Consumer Discretionary › Men'S And Boys' Furnishings, Work Clothing, And Allied Garments

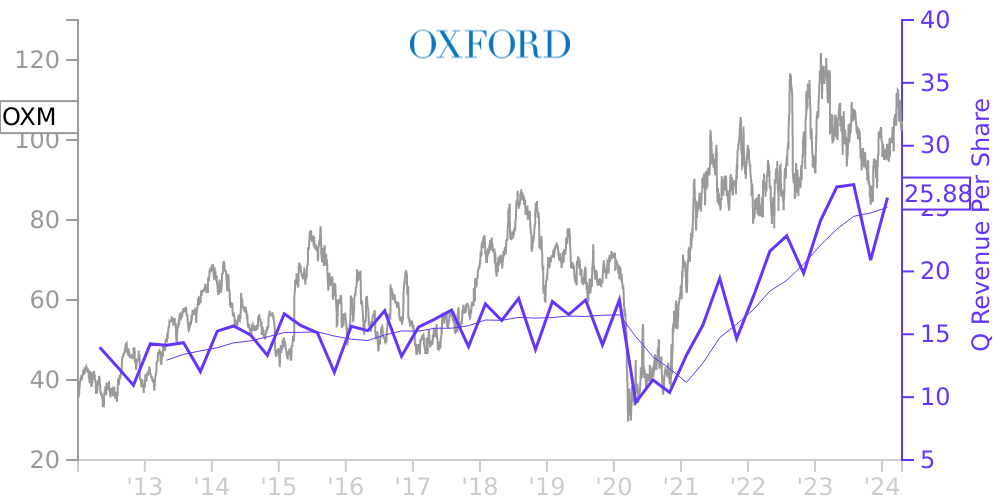
OXM Stock Price Correlated With Oxford Industries Financials
External Links ⌄
Income Statement
Cash Flow
Balance Sheet
OXM Income Statement
Enable JavaScript and reload
Revenue, Net:
Cost of Goods & Services Sold:
Gross Profit:
Selling, General & Admin Expense:
Research & Development Expense:
Total Operating Expenses:
Operating Income:
Income Taxes:
Net Income:
OXM Cash Flow
Enable JavaScript and reload
Operating Activities Net Income:
Depreciation, Depletion & Amortization:
Change in Accounts Receiveable:
Net Cash from Operations:
Repurchases/Buybacks Common Stock:
Issuance of Long-term Debt:
Cash Dividends Paid:
Net Cash from Financing Activities:
Property, Plant & Equipment Purchases:
Purchases of Businesses, Net of Cash:
Net Cash from Investing Activities:
Net Change in Cash & Equivalents:
OXM Balance Sheet
Enable JavaScript and reload
Cash and Cash Equivalents:
Short-Term Investments:
Accounts Receivable, Net:
Inventories:
Total Current Assets:
Property, Plant & Equipment, Net:
Total Assets:
Accounts Payable:
Current Portion of Long-Term Debt:
Total Short-Term Liabilities:
Long Term Debt, Non-Current Portion:
Total Long-Term Liabilities:
Total Liabilities:
COMPANY PROFILE
Note 1. Business and Summary of Significant Accounting Policies Description of Business We are a leading branded apparel company that designs, sources, markets and distributes products bearing the trademarks of our Tommy Bahama®, Lilly Pulitzer®, Southern Tide®, The Beaufort Bonnet Company® and Duck Head® lifestyle brands. We distribute our products through our direct to consumer channel, consisting of retail stores and e-commerce sites, and our wholesale distribution channel, which includes better department stores, specialty stores, multi-branded e-commerce retailers, off-price retailers and other retailers. Additionally, we operate Tommy Bahama food and beverage locations, including Marlin Bars and full-service restaurants, generally adjacent to a Tommy Bahama retail store location. In Fiscal 2020, we decided to exit our Lanier Apparel business, a business which had been focused on moderately priced tailored clothing and related products. This decision aligns with our stated business strategy of developing and marketing compelling lifestyle brands. It also took into consideration the increased macroeconomic challenges faced by the Lanier Apparel business, many of which were magnified by the COVID-19 pandemic. The exit of the Lanier Apparel business was completed in Fiscal 2021. Refer to Note 2 for certain financial information about Lanier Apparel and Note 11 for a description of certain information relating to the exit of Lanier Apparel, including charges associated with the exit of the business. COVID-19 Pandemic The COVID-19 pandemic has had a significant effect on overall economic conditions and our operations in Fiscal 2020 and Fiscal 2021. While our mission remains the enhancement of long-term shareholder value, our focus during this crisis has been (1) the health and well-being of our employees, customers and communities, (2) protecting the reputation, value and image of our brands and (3) preserving liquidity. In Fiscal 2020, due to the COVID-19 pandemic, we temporarily closed all our retail and restaurant locations, resulting in a reduction in net sales and a significant net loss after many years of profitable operating results. We began reopening our stores and restaurants in the Second Quarter of Fiscal 2020 in a phased approach in accordance with local government guidelines and with additional safety protocols. After reopening many of our locations we continued to experience reduced traffic, limited operating hours and capacity, seating and other limitations, with such factors impacting individual locations to varying degrees. There can be no assurance that additional closures will not occur in the future as a result of any resurgence of COVID-19 cases and/or additional government mandates or recommendations. In addition, the shift from in-store shopping to online shopping accelerated in Fiscal 2020 resulting in strong growth in our e-commerce businesses. In Fiscal 2021, the economic environment improved significantly with a significant rebound in retail traffic. This improved environment and exceptionally strong consumer demand drove increased net sales and record net earnings. There can be no assurance that these traffic and other trends will continue for our business or the broader retail apparel market. There remains significant uncertainty as to the duration and severity of the pandemic as well as the associated impact of changes in consumer discretionary spending habits, supply chain and other business disruptions, operating cost increases and inflationary pressures, general economic conditions and restrictions on our ongoing operations that result from the COVID-19 pandemic. Thus, the ultimate impact of the pandemic on our business is uncertain at this time. Fiscal Year We operate and report on a 52/53-week fiscal year. Our fiscal year ends on the Saturday closest to January 31 and is designated by the calendar year in which the fiscal year commences. As used in our consolidated financial statements, the
Free historical financial statements for Oxford Industries Inc. See how revenue, income, cash flow, and balance sheet financials have changed over 57 quarters since 2012. Compare with OXM stock chart to see long term trends.
Data imported from Oxford Industries Inc SEC filings. Check original filings before making any investment decision.