Energy › Crude Petroleum And Natural Gas

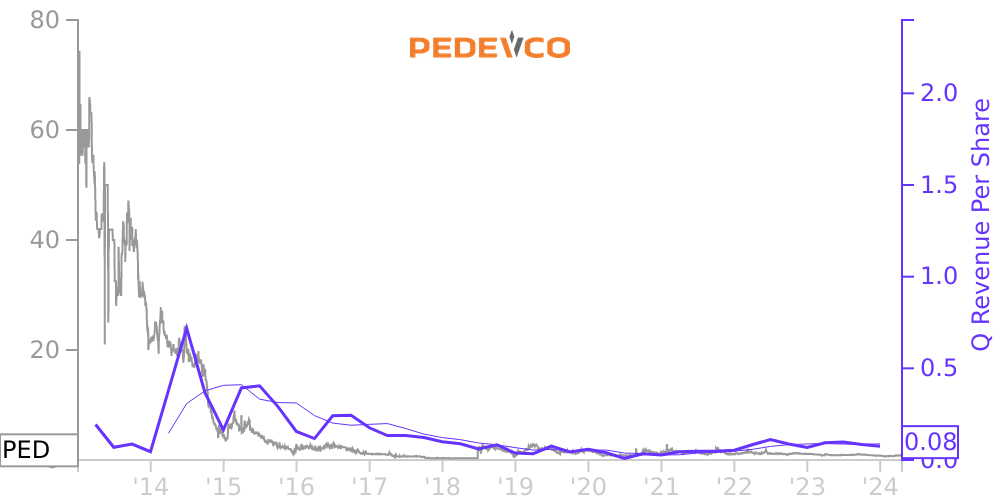
PED Stock Price Correlated With PEDEVCO Financials
External Links ⌄
Income Statement
Cash Flow
Balance Sheet
PED Income Statement
Enable JavaScript and reload
Revenue, Net:
Cost of Goods & Services Sold:
Gross Profit:
Selling, General & Admin Expense:
Research & Development Expense:
Total Operating Expenses:
Operating Income:
Income Taxes:
Net Income:
PED Cash Flow
Enable JavaScript and reload
Operating Activities Net Income:
Depreciation, Depletion & Amortization:
Change in Accounts Receiveable:
Net Cash from Operations:
Repurchases/Buybacks Common Stock:
Issuance of Long-term Debt:
Cash Dividends Paid:
Net Cash from Financing Activities:
Property, Plant & Equipment Purchases:
Purchases of Businesses, Net of Cash:
Net Cash from Investing Activities:
Net Change in Cash & Equivalents:
PED Balance Sheet
Enable JavaScript and reload
Cash and Cash Equivalents:
Short-Term Investments:
Accounts Receivable, Net:
Inventories:
Total Current Assets:
Property, Plant & Equipment, Net:
Total Assets:
Accounts Payable:
Current Portion of Long-Term Debt:
Total Short-Term Liabilities:
Long Term Debt, Non-Current Portion:
Total Long-Term Liabilities:
Total Liabilities:
COMPANY PROFILE
Basis of Presentation and Principles of Consolidation. The consolidated financial statements herein have been prepared in accordance with GAAP and include the accounts of the Company and those of its wholly and partially-owned subsidiaries as follows: (i) Blast AFJ, Inc., a Delaware corporation; (ii) PEDCO, a Nevada corporation; (iii) Red Hawk, a Nevada limited liability company; (iv) Ridgeway Arizona Oil Corp., an Arizona corporation (“RAOC”); (v) EOR Operating Company, a Texas corporation (“EOR”); and (vi) SRPT Acquisition, LLC, a Texas limited liability company formed on October 16, 2020. All significant intercompany accounts and transactions have been eliminated.
Free historical financial statements for PEDEVCO Corp.. See how revenue, income, cash flow, and balance sheet financials have changed over 54 quarters since 2013. Compare with PED stock chart to see long term trends.
Data imported from PEDEVCO Corp. SEC filings. Check original filings before making any investment decision.