Industrials › Printed Circuit Boards

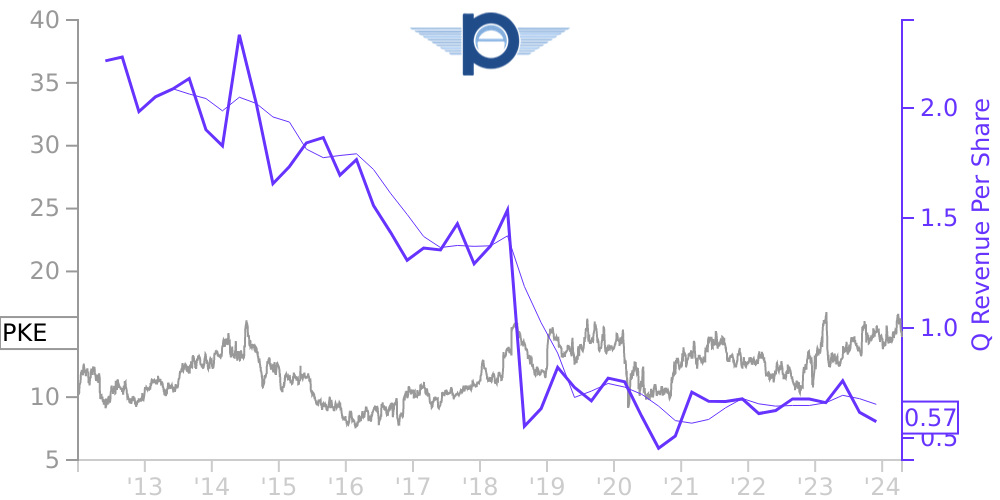
PKE Stock Price Correlated With Park Aerospace Financials
External Links ⌄
Income Statement
Cash Flow
Balance Sheet
PKE Income Statement
Enable JavaScript and reload
Revenue, Net:
Cost of Goods & Services Sold:
Gross Profit:
Selling, General & Admin Expense:
Research & Development Expense:
Total Operating Expenses:
Operating Income:
Income Taxes:
Net Income:
PKE Cash Flow
Enable JavaScript and reload
Operating Activities Net Income:
Depreciation, Depletion & Amortization:
Change in Accounts Receiveable:
Net Cash from Operations:
Repurchases/Buybacks Common Stock:
Issuance of Long-term Debt:
Cash Dividends Paid:
Net Cash from Financing Activities:
Property, Plant & Equipment Purchases:
Purchases of Businesses, Net of Cash:
Net Cash from Investing Activities:
Net Change in Cash & Equivalents:
PKE Balance Sheet
Enable JavaScript and reload
Cash and Cash Equivalents:
Short-Term Investments:
Accounts Receivable, Net:
Inventories:
Total Current Assets:
Property, Plant & Equipment, Net:
Total Assets:
Accounts Payable:
Current Portion of Long-Term Debt:
Total Short-Term Liabilities:
Long Term Debt, Non-Current Portion:
Total Long-Term Liabilities:
Total Liabilities:
COMPANY PROFILE
1. CONSOLIDATED FINANCIAL STATEMENTS
The Condensed Consolidated Balance Sheet and the Consolidated Statement of Shareholders’ Equity as of May 29, 2022, the Consolidated Statements of Operations and the Consolidated Statements of Comprehensive Earnings for the 13 weeks ended May 29, 2022 and May 30, 2021, and the Condensed Consolidated Statements of Cash Flows for the 13 weeks then ended have been prepared by Park Aerospace Corp. (the “Company”), without audit. In the opinion of management, these unaudited condensed consolidated financial statements contain all adjustments (which include only normal recurring adjustments) necessary to present fairly the financial position at May 29, 2022 and the results of operations and cash flows for all periods presented. The Consolidated Statements of Operations are not necessarily indicative of the results to be expected for the full fiscal year or any subsequent interim period.
Certain information and footnote disclosures normally included in financial statements prepared in accordance with accounting principles generally accepted in the United States of America (“US GAAP”) have been condensed or omitted. It is suggested that these condensed consolidated financial statements be read in conjunction with the consolidated financial statements and notes thereto included in the Company’s Annual Report on Form 10 -K for the fiscal year ended February 27, 2022. There have been no significant changes to such accounting policies during the 13 weeks ended May 29, 2022.
Free historical financial statements for Park Aerospace Corp.. See how revenue, income, cash flow, and balance sheet financials have changed over 57 quarters since 2012. Compare with PKE stock chart to see long term trends.
Data imported from Park Aerospace Corp. SEC filings. Check original filings before making any investment decision.