
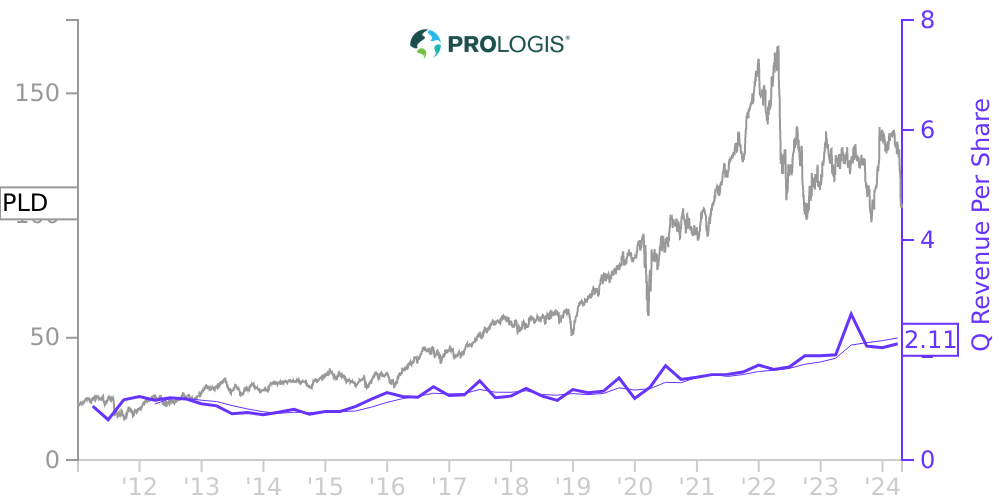
PLD Stock Price Correlated With Prologis Financials
External Links ⌄
Income Statement
Cash Flow
Balance Sheet
PLD Income Statement
Enable JavaScript and reload
Revenue, Net:
Cost of Goods & Services Sold:
Gross Profit:
Selling, General & Admin Expense:
Research & Development Expense:
Total Operating Expenses:
Operating Income:
Income Taxes:
Net Income:
PLD Cash Flow
Enable JavaScript and reload
Operating Activities Net Income:
Depreciation, Depletion & Amortization:
Change in Accounts Receiveable:
Net Cash from Operations:
Repurchases/Buybacks Common Stock:
Issuance of Long-term Debt:
Cash Dividends Paid:
Net Cash from Financing Activities:
Property, Plant & Equipment Purchases:
Purchases of Businesses, Net of Cash:
Net Cash from Investing Activities:
Net Change in Cash & Equivalents:
PLD Balance Sheet
Enable JavaScript and reload
Cash and Cash Equivalents:
Short-Term Investments:
Accounts Receivable, Net:
Inventories:
Total Current Assets:
Property, Plant & Equipment, Net:
Total Assets:
Accounts Payable:
Current Portion of Long-Term Debt:
Total Short-Term Liabilities:
Long Term Debt, Non-Current Portion:
Total Long-Term Liabilities:
Total Liabilities:
COMPANY PROFILE
NOTE 1. DESCRIPTION OF THE BUSINESS
Prologis, Inc. (or the “Parent”) commenced operations as a fully integrated real estate company in 1997, elected to be taxed as a real estate investment trust (“REIT”) under the Internal Revenue Code of 1986, as amended (the “Internal Revenue Code” or “IRC”), and believes the current organization and method of operation will enable it to maintain its status as a REIT. The Parent is the general partner of Prologis, L.P. (or the “Operating Partnership” or “OP”). Through the OP, we are engaged in the ownership, acquisition, development and management of logistics facilities with a focus on key markets in 19 countries on four continents. We invest in real estate through wholly owned subsidiaries and other entities through which we co-invest with partners and investors. We maintain a significant level of ownership in these co-investment ventures, which may be consolidated or unconsolidated based on our level of control of the entity. Our current business strategy consists of two operating business segments: Real Estate Operations and Strategic Capital. Our Real Estate Operations segment represents the ownership and development of logistics properties. Our Strategic Capital segment represents the management of unconsolidated co-investment ventures and other ventures. See Note 17 for further discussion of our business segments. Unless otherwise indicated, the Notes to the Consolidated Financial Statements apply to both the Parent and the OP. The terms “the Company,” “Prologis,” “we,” “our” or “us” means the Parent and OP collectively.
For each share of preferred or common stock the Parent issues, the OP issues a corresponding preferred or common partnership unit, as applicable, to the Parent in exchange for the contribution of the proceeds from the stock issuance. At December 31, 2021, the Parent owned a 97.32% common general partnership interest in the OP and substantially all of the preferred units in the OP. The remaining 2.68% common limited partnership interests, which include Class A common limited partnership units (“Class A Units”) in the OP, are owned by unaffiliated investors and certain current and former directors and officers of the Parent. Each partner’s percentage interest in the OP is determined based on the number of OP units held, including the number of OP units into which Class A Units are convertible, compared to total OP units outstanding at each period end and is used as the basis for the allocation of net income or loss to each partner. At the end of each reporting period, a capital adjustment is made in the OP to reflect the appropriate ownership interest for each of the common unitholders. These adjustments are reflected in the line items Reallocation of Equity in the Consolidated Statements of Equity of the Parent and Reallocation of Capital in the Consolidated Statements of Capital of the OP.
As the sole general partner of the OP, the Parent has complete responsibility and discretion in the day-to-day management and control of the OP and we operate the Parent and the OP as one enterprise. The management of the Parent consists of the same members as the management of the OP. These members are officers of the Parent and employees of the OP or one of its subsidiaries. As general partner with control of the OP, the Parent is the primary beneficiary and therefore consolidates the OP. Because the Parent’s only significant asset is its investment in the OP, the assets and liabilities of the Parent and the OP are the same on their respective financial statements.
Information with respect to the square footage, number of buildings and acres of land is unaudited.
Free historical financial statements for Prologis Inc.. See how revenue, income, cash flow, and balance sheet financials have changed over 61 quarters since 2011. Compare with PLD stock chart to see long term trends.
Data imported from Prologis Inc. SEC filings. Check original filings before making any investment decision.