Industrials › Construction Machinery And Equip

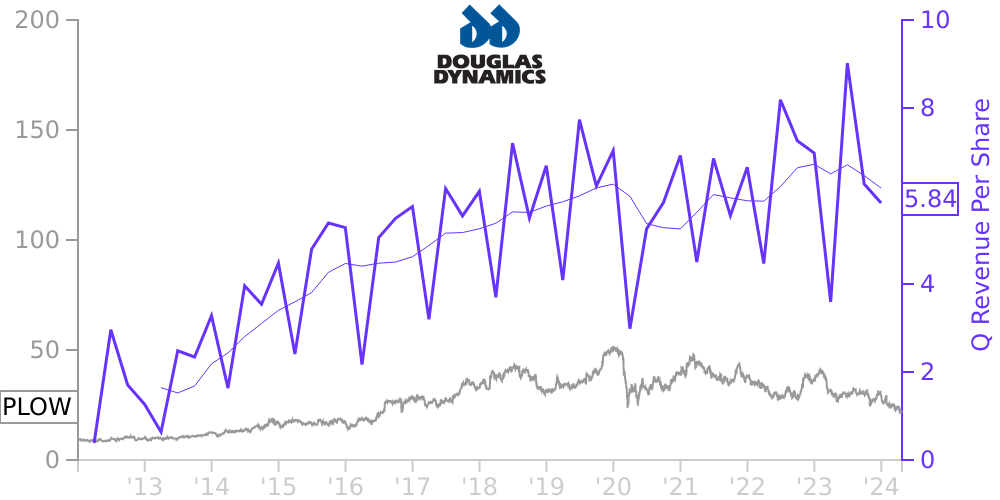
PLOW Stock Price Correlated With Douglas Dynamics Financials
External Links ⌄
Income Statement
Cash Flow
Balance Sheet
PLOW Income Statement
Enable JavaScript and reload
Revenue, Net:
Cost of Goods & Services Sold:
Gross Profit:
Selling, General & Admin Expense:
Research & Development Expense:
Total Operating Expenses:
Operating Income:
Income Taxes:
Net Income:
PLOW Cash Flow
Enable JavaScript and reload
Operating Activities Net Income:
Depreciation, Depletion & Amortization:
Change in Accounts Receiveable:
Net Cash from Operations:
Repurchases/Buybacks Common Stock:
Issuance of Long-term Debt:
Cash Dividends Paid:
Net Cash from Financing Activities:
Property, Plant & Equipment Purchases:
Purchases of Businesses, Net of Cash:
Net Cash from Investing Activities:
Net Change in Cash & Equivalents:
PLOW Balance Sheet
Enable JavaScript and reload
Cash and Cash Equivalents:
Short-Term Investments:
Accounts Receivable, Net:
Inventories:
Total Current Assets:
Property, Plant & Equipment, Net:
Total Assets:
Accounts Payable:
Current Portion of Long-Term Debt:
Total Short-Term Liabilities:
Long Term Debt, Non-Current Portion:
Total Long-Term Liabilities:
Total Liabilities:
COMPANY PROFILE
1. Description of business and basis of presentation Douglas Dynamics, Inc. (the “Company,”) is a premier manufacturer and upfitter of commercial v ehicle attachments and equipment. The Company’s portfolio includes snow and ice management attachments sold under the BLIZZARD ® , FISHER ® , HENDERSON ® , SNOWEX ® and WESTERN ® brands, turf care equipment under the TURFEX ® brand, and industrial maintenance equipment under the SWEEPEX ® brand. The Company’s portfolio also includes the up-fit of market leading attachments and storage solutions under the HENDERSON® brand, and the DEJANA® brand and its related sub-brands. The Company is headquartered in Milwaukee, WI and currently owns manufacturing and upfit facilities in Milwaukee, WI, Manchester Iowa, Rockland, ME, Madison Heights, MI and Huntley, IL. The Company also leases fifteen manufacturing and upfit and service facilities located in Iowa, Maryland, Missouri, New Jersey, New York, Ohio, Pennsylvania, and Rhode Island. Additionally, the Company operates a sourcing office in China. The Company conducts business in two segments: Work Truck Attachments and Work Truck Solutions. During the first quarter of 2019, the Company reorganized its business segments to reflect a new operating structure as a result of a change in how the Company’s chief operating decision maker allocates resources, makes operating decisions and assesses the performance of the business. Financial information regarding these segments is in Note 17 to the Consolidated Financial Statements. Recently adopted accounting standards There were no accounting standards adopted in the year ended December 31, 2021. See Note 22 for a summary of recent accounting pronouncements not yet adopted and the Company’s evaluation of their impact on the financial statements.
Free historical financial statements for Douglas Dynamics Inc. See how revenue, income, cash flow, and balance sheet financials have changed over 57 quarters since 2012. Compare with PLOW stock chart to see long term trends.
Data imported from Douglas Dynamics Inc SEC filings. Check original filings before making any investment decision.