Industrials › Services-Computer Integrated Systems Design

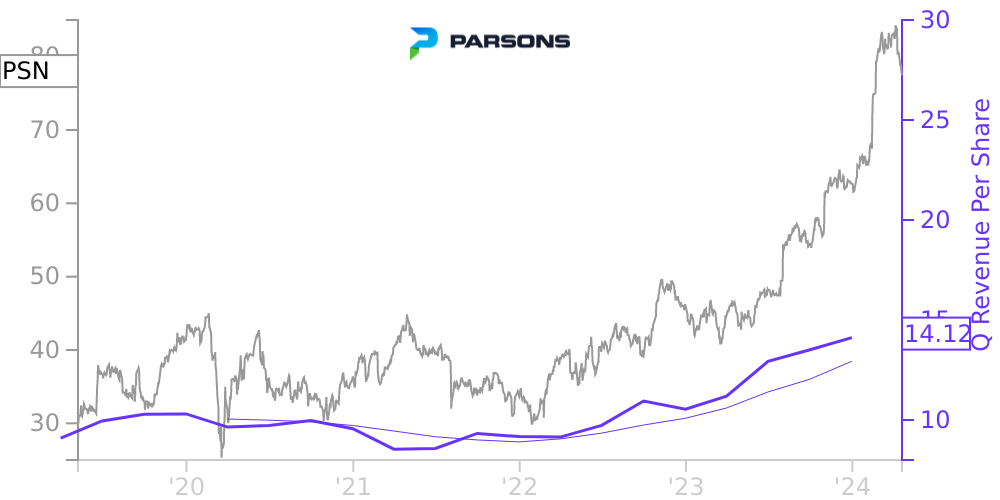
PSN Stock Price Correlated With Parsons Financials
External Links ⌄
Income Statement
Cash Flow
Balance Sheet
PSN Income Statement
Enable JavaScript and reload
Revenue, Net:
Cost of Goods & Services Sold:
Gross Profit:
Selling, General & Admin Expense:
Research & Development Expense:
Total Operating Expenses:
Operating Income:
Income Taxes:
Net Income:
PSN Cash Flow
Enable JavaScript and reload
Operating Activities Net Income:
Depreciation, Depletion & Amortization:
Change in Accounts Receiveable:
Net Cash from Operations:
Repurchases/Buybacks Common Stock:
Issuance of Long-term Debt:
Cash Dividends Paid:
Net Cash from Financing Activities:
Property, Plant & Equipment Purchases:
Purchases of Businesses, Net of Cash:
Net Cash from Investing Activities:
Net Change in Cash & Equivalents:
PSN Balance Sheet
Enable JavaScript and reload
Cash and Cash Equivalents:
Short-Term Investments:
Accounts Receivable, Net:
Inventories:
Total Current Assets:
Property, Plant & Equipment, Net:
Total Assets:
Accounts Payable:
Current Portion of Long-Term Debt:
Total Short-Term Liabilities:
Long Term Debt, Non-Current Portion:
Total Long-Term Liabilities:
Total Liabilities:
COMPANY PROFILE
2.
Summary of Significant Accounting Policies
Basis of Presentation and Principles of Consolidation
The accompanying consolidated financial statements have been prepared in accordance with accounting principles generally accepted in the United States of America (“U.S. GAAP”) and include the accounts of Parsons Corporation and its subsidiaries and affiliates which it controls. Interests in joint ventures that are controlled by the Company, or for which the Company is otherwise deemed to be the primary beneficiary, are consolidated. For joint ventures in which the Company does not have a controlling interest, but exerts significant influence, the Company applies the equity method of accounting. Intercompany accounts and transactions are eliminated in consolidation.
Use of Estimates
The preparation of the consolidated financial statements in accordance with U.S. GAAP requires management to make estimates and assumptions that affect the reported amounts of assets and liabilities at the date of the financial statements and the reported amounts of revenues and expenses during the reporting period. Actual amounts could differ from those estimates. The Company’s most significant estimates and judgments involve revenue recognition with respect to the determination of the costs to complete contracts and transaction price; determination of self-insurance reserves; useful lives of
property and equipment and intangible assets; valuation of deferred income tax assets and uncertain tax positions, among others.
ESOP
The Company maintains a non-leveraged ESOP for eligible employees, for which the Company contributes shares of its own stock to the ESOP trust each year. Throughout the year, as employee services are rendered, the Company records compensation expense based on salaries of eligible employees. At each reporting period, the shares held within the ESOP or committed to be contributed to the ESOP are adjusted to their redemption value through an offsetting charge or credit to accumulated deficit.
Treasury Stock
The Company records treasury stock purchases under the cost method whereby the entire cost of the acquired stock is recorded as treasury stock. The Company records the reissuance of treasury stock using the first-in, first-out method of accounting. Contributions of 1,631,477 shares, 1,522,381 shares, and 1,345,198 shares of common stock were made to the ESOP in 2021, 2020 and 2019, respectively. In 2019, the Company repurchased 191,331 shares of common stock from the ESOP in connection with the redemption of ESOP participants’ interests in the ESOP for $6.3 million. Subsequent to November 3, 2019 when the 180-day lock-up period ended, repurchases are no longer required for ESOP redemptions. In 2020, the Company did not repurchase any shares of common stock.
Share Repurchases
During the third quarter of 2021, the Company’s Board of Directors authorized the Company to acquire a number of shares of Common Stock having an aggregate market value of not greater than $100,000,000 from time to time. Repurchased shares of common stock are retired and included in “Repurchases of common stock” in cash flows from financing activities in the Consolidated Statements of Cash Flows.
Earnings per Share
Basic earnings per common share (“EPS”) is calculated by dividing Net income by the weighted average number of common shares outstanding during the year. Diluted earnings per common share is calculated using the if-converted method by dividing adjusted net income by adjusted weighted average outstanding shares, assuming conversion of all potentially dilutive securities. Upon contribution to the ESOP, the shares become outstanding and are included within the earnings per share computations.
Revenue Recognition
In accordance with ASC 606, the Company follows the five-step process in ASC 606 to recognize revenue:
1.
Identify the contract
2.
Identify performance obligations
3.
Determine the transaction price
4.
Allocate the transaction price
Free historical financial statements for Parsons Corp. See how revenue, income, cash flow, and balance sheet financials have changed over 29 quarters since 2019. Compare with PSN stock chart to see long term trends.
Data imported from Parsons Corp SEC filings. Check original filings before making any investment decision.