Energy › Drilling Oil And Gas Wells

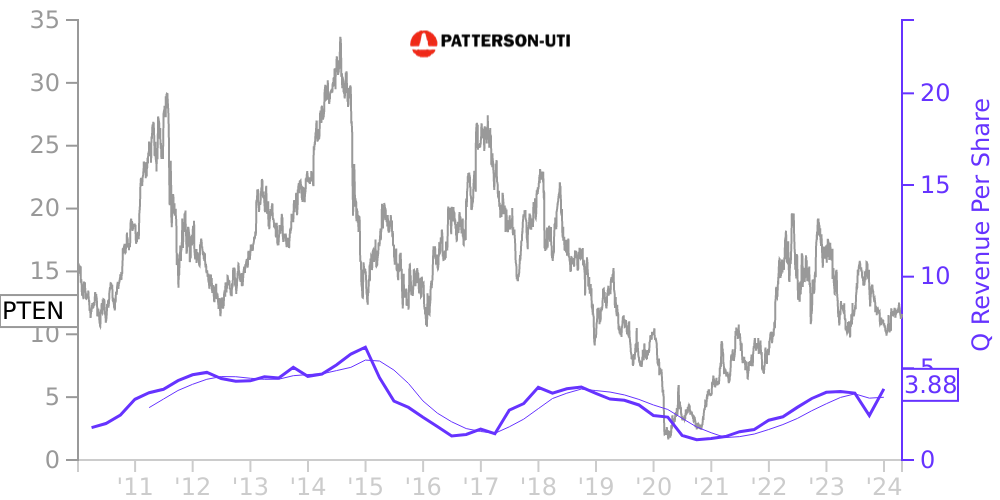
PTEN Stock Price Correlated With Patterson-UTI Energy Financials
External Links ⌄
Income Statement
Cash Flow
Balance Sheet
PTEN Income Statement
Enable JavaScript and reload
Revenue, Net:
Cost of Goods & Services Sold:
Gross Profit:
Selling, General & Admin Expense:
Research & Development Expense:
Total Operating Expenses:
Operating Income:
Income Taxes:
Net Income:
PTEN Cash Flow
Enable JavaScript and reload
Operating Activities Net Income:
Depreciation, Depletion & Amortization:
Change in Accounts Receiveable:
Net Cash from Operations:
Repurchases/Buybacks Common Stock:
Issuance of Long-term Debt:
Cash Dividends Paid:
Net Cash from Financing Activities:
Property, Plant & Equipment Purchases:
Purchases of Businesses, Net of Cash:
Net Cash from Investing Activities:
Net Change in Cash & Equivalents:
PTEN Balance Sheet
Enable JavaScript and reload
Cash and Cash Equivalents:
Short-Term Investments:
Accounts Receivable, Net:
Inventories:
Total Current Assets:
Property, Plant & Equipment, Net:
Total Assets:
Accounts Payable:
Current Portion of Long-Term Debt:
Total Short-Term Liabilities:
Long Term Debt, Non-Current Portion:
Total Long-Term Liabilities:
Total Liabilities:
COMPANY PROFILE
1. Description of Business and Summary of Significant Accounting Policies A description of the business and basis of presentation follows: Description of business — Patterson-UTI Energy, Inc., through its wholly-owned subsidiaries (collectively referred to herein as “we,” “us,” “our,” “ours” and like terms), is a Houston, Texas-based oilfield services company that primarily owns and operates in the United States one of the largest fleets of land-based drilling rigs and a large fleet of pressure pumping equipment. Our contract drilling business operates in the continental United States and internationally in Colombia and, from time to time, we pursue contract drilling opportunities in other select markets. Our pressure pumping business operates primarily in Texas and the Appalachian region. We also provide a comprehensive suite of directional drilling services in most major producing onshore oil and gas basins in the United States, and we provide services that improve the statistical accuracy of directional and horizontal wellbores. We have other operations through which we provide oilfield rental tools in select markets in the United States. We also service equipment for drilling contractors, and we provide electrical controls and automation to the energy, marine and mining industries, in North America and other select markets. In addition, we own and invest, as a non-operating, working interest owner, in oil and natural gas assets that are primarily located in Texas and New Mexico. In the fourth quarter of 2021, we completed the acquisition of Pioneer Energy Services Corp. (“Pioneer” ). Through the Pioneer acquisition, we acquired Pioneer’s 100 % pad-capable drilling rig fleet consisting of 17 AC-powered rigs in the United States and eight SCR rigs in Colombia and production services assets consisting of 123 well servicing rigs and 72 wireline services units. The well servicing rigs and wireline services units, as discussed below, were subsequently divested. We believe the acquisition of Pioneer enhances our position as a leading provider of contract drilling services in the United States and expands our geographic footprint into Latin America, see Note 2. On December 31, 2021, we completed the sale of the previously acquired well servicing rig business and wireline business (collectively, “ Pioneer Production Services”), to Clearwell Dynamics, LLC (“Clearwell”). The sale price was $ 43.0 million in cash consideration, subject to customary purchase price adjustments at closing for cash and working capital. The results of operations of these businesses have been presented as a discontinued operation in these consolidated financial statements, s ee Note 2. In the second quarter of 2020, we closed our Canadian drilling operations in response to our longer-term outlook for the western Canadian market. As a result of the closure, we recorded an impairment of $ 8.3 million. Basis of presentation — The consolidated financial statements include the accounts of Patterson-UTI and its wholly-owned subsidiaries. All significant intercompany accounts and transactions have been eliminated. Except for wholly-owned subsidiaries, we have no controlling financial interests in any other entity which would require consolidation. As used in these notes, “we,” “us,” “our,” “ours” and like terms refer collectively to Patterson-UTI Energy, Inc. and its consolidated subsidiaries. Patterson-UTI Energy, Inc. conducts its business operations through its wholly-owned subsidiaries and has no employees or independent operations. Certain prior year amounts have been reclassified to conform to current year presentation. The U.S. dollar is the functional currency for all of our operations except for our Canadian operations, which used the Canadian dollar as their functional currency. The effects of exchange rate changes are reflected in accumulated other comprehensive income, which is a separate component of stockholders’ equity. A summary of the significant
Free historical financial statements for Patterson-UTI Energy Inc. See how revenue, income, cash flow, and balance sheet financials have changed over 65 quarters since 2010. Compare with PTEN stock chart to see long term trends.
Data imported from Patterson-UTI Energy Inc SEC filings. Check original filings before making any investment decision.