Consumer Discretionary › Electronic And Other Electrical Equipment (No Computer Equip)

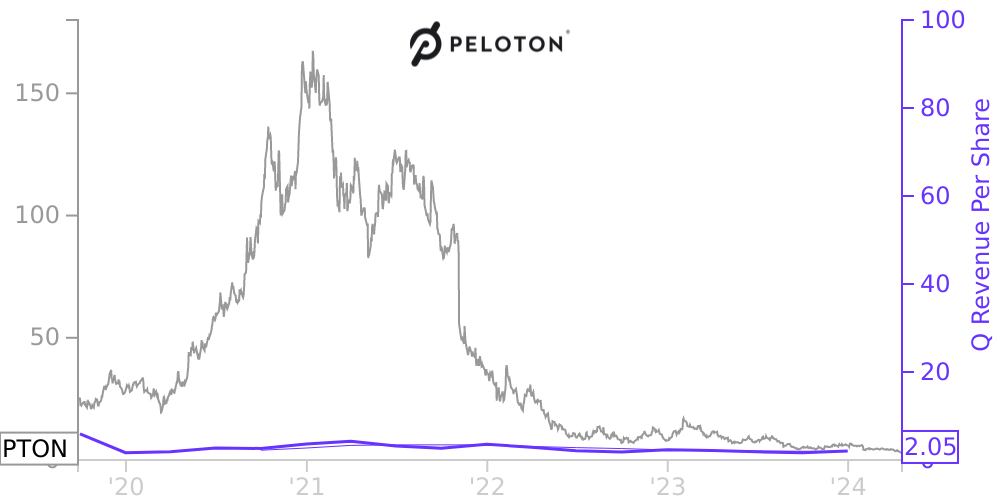
PTON Stock Price Correlated With Peloton Interactive Financials
External Links ⌄
Income Statement
Cash Flow
Balance Sheet
PTON Income Statement
Enable JavaScript and reload
Revenue, Net:
Cost of Goods & Services Sold:
Gross Profit:
Selling, General & Admin Expense:
Research & Development Expense:
Total Operating Expenses:
Operating Income:
Income Taxes:
Net Income:
PTON Cash Flow
Enable JavaScript and reload
Operating Activities Net Income:
Depreciation, Depletion & Amortization:
Change in Accounts Receiveable:
Net Cash from Operations:
Repurchases/Buybacks Common Stock:
Issuance of Long-term Debt:
Cash Dividends Paid:
Net Cash from Financing Activities:
Property, Plant & Equipment Purchases:
Purchases of Businesses, Net of Cash:
Net Cash from Investing Activities:
Net Change in Cash & Equivalents:
PTON Balance Sheet
Enable JavaScript and reload
Cash and Cash Equivalents:
Short-Term Investments:
Accounts Receivable, Net:
Inventories:
Total Current Assets:
Property, Plant & Equipment, Net:
Total Assets:
Accounts Payable:
Current Portion of Long-Term Debt:
Total Short-Term Liabilities:
Long Term Debt, Non-Current Portion:
Total Long-Term Liabilities:
Total Liabilities:
COMPANY PROFILE
Description of Business and Basis of Presentation Description and Organization
Peloton Interactive, Inc. ("Peloton" or the “Company”) is the largest interactive fitness platform in the world with a loyal community of Members, which we define as any individual who has a Peloton account through a paid Connected Fitness Subscription or a paid Peloton Digital Subscription. The Company pioneered connected, technology-enabled fitness with the creation of its interactive fitness equipment ("Connected Fitness Products") and the streaming of immersive, instructor-led boutique classes to its Members anytime, anywhere. The Company makes fitness entertaining, approachable, effective, and convenient while fostering social connections that encourage its Members to be the best versions of themselves.
Basis of Presentation and Consolidation
The accompanying consolidated financial statements have been prepared in accordance with accounting principles generally accepted in the United States ("GAAP") and applicable rules and regulations of the U.S. Securities and Exchange Commission ("SEC"). The consolidated financial statements include the accounts of Peloton Interactive, Inc. and its subsidiaries in which the Company has a controlling financial interest. All significant intercompany balances and transactions have been eliminated.
Certain monetary amounts, percentages, and other figures included elsewhere in these financial statements have been subject to rounding adjustments. Accordingly, figures shown as totals in certain tables may not be the arithmetic aggregation of the figures that precede them, and figures expressed as percentages in the text may not total 100% or, as applicable, when aggregated may not be the arithmetic aggregation of the percentages that precede them.
Free historical financial statements for Peloton Interactive Inc. See how revenue, income, cash flow, and balance sheet financials have changed over 27 quarters since 2019. Compare with PTON stock chart to see long term trends.
Data imported from Peloton Interactive Inc SEC filings. Check original filings before making any investment decision.