Technology › Radio And Tv Broadcasting And Communications Equipment

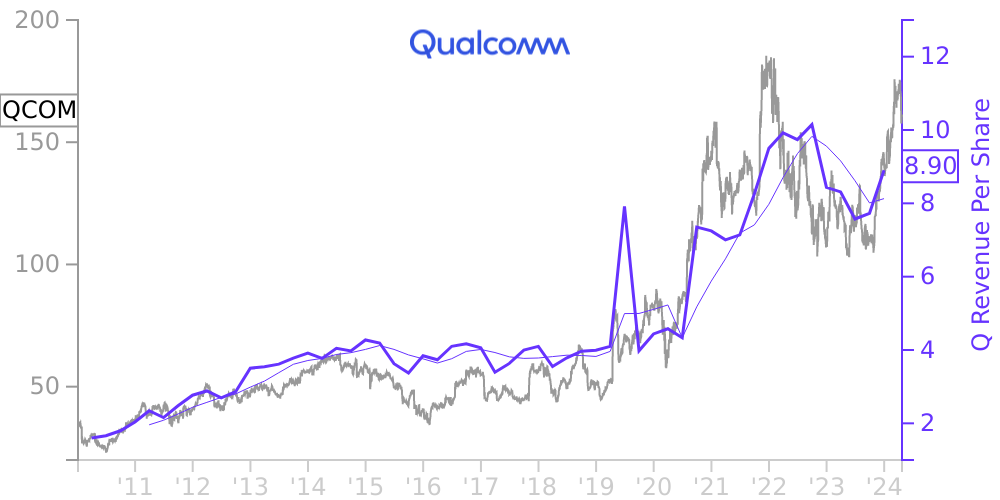
QCOM Stock Price Correlated With QUALCOMM Financials
External Links ⌄
Income Statement
Cash Flow
Balance Sheet
QCOM Income Statement
Enable JavaScript and reload
Revenue, Net:
Cost of Goods & Services Sold:
Gross Profit:
Selling, General & Admin Expense:
Research & Development Expense:
Total Operating Expenses:
Operating Income:
Income Taxes:
Net Income:
QCOM Cash Flow
Enable JavaScript and reload
Operating Activities Net Income:
Depreciation, Depletion & Amortization:
Change in Accounts Receiveable:
Net Cash from Operations:
Repurchases/Buybacks Common Stock:
Issuance of Long-term Debt:
Cash Dividends Paid:
Net Cash from Financing Activities:
Property, Plant & Equipment Purchases:
Purchases of Businesses, Net of Cash:
Net Cash from Investing Activities:
Net Change in Cash & Equivalents:
QCOM Balance Sheet
Enable JavaScript and reload
Cash and Cash Equivalents:
Short-Term Investments:
Accounts Receivable, Net:
Inventories:
Total Current Assets:
Property, Plant & Equipment, Net:
Total Assets:
Accounts Payable:
Current Portion of Long-Term Debt:
Total Short-Term Liabilities:
Long Term Debt, Non-Current Portion:
Total Long-Term Liabilities:
Total Liabilities:
COMPANY PROFILE
Significant Accounting Policies We are a global leader in the development and commercialization of foundational technologies for the wireless industry. Our technologies and products are used in mobile devices and other wireless products, including those used in the internet of things (IoT) and automotive systems for telematics, connectivity and digital cockpit (also known as infotainment). We derive revenues principally from sales of integrated circuit products and through the licensing of our intellectual property, including patents and other rights.
Principles of Consolidation. The consolidated financial statements include the assets, liabilities and operating results of Qualcomm and its subsidiaries. Intercompany transactions and balances have been eliminated.
Financial Statement Preparation. The preparation of financial statements in conformity with accounting principles generally accepted in the United States of America (GAAP) requires management to make estimates and assumptions that affect the reported amounts and the disclosure of contingent amounts in our consolidated financial statements and the accompanying notes. Examples of our significant accounting estimates and policies that may involve a higher degree of judgment and complexity than others include: the estimation of sales-based royalty revenues; the impairment of non-marketable equity investments; the valuation of inventories; the impairment of goodwill and long-lived assets; the recognition, measurement and disclosure of loss contingencies related to legal and regulatory proceedings; and the calculation of our income tax provision, including the recognition and measurement of uncertain tax positions. Actual results could differ from those estimates. Certain prior year amounts have been reclassified to conform to the current year presentation.
Fiscal Year. We operate and report using a 52-53 week fiscal year ending on the last Sunday in September. The fiscal years ended September 26, 2021, September 27, 2020 and September 29, 2019 each included 52 weeks.
Recently Adopted Accounting Pronouncements.
Financial Assets: In June 2016, the Financial Accounting Standards Board (FASB) issued new accounting guidance that changed the accounting for recognizing impairments of financial assets (ASC 326). Under the new accounting guidance, credit losses for financial assets held at amortized cost (such as accounts receivable) are estimated based on expected losses rather than the previous incurred loss impairment model. The new accounting guidance also eliminated the concept of other-than-temporary impairment with credit losses related to available-for-sale debt securities recorded through an allowance for credit losses rather than as a reduction in the amortized cost basis of the securities. We adopted the new accounting guidance in the first quarter of fiscal 2021 under the modified retrospective transition method, except for certain available-for-sale debt securities where the prospective transition method was required, and as a result, prior period results have not been restated. The impact upon adoption was not material to our consolidated financial statements. The future impact of such accounting guidance will largely depend on the future composition and credit quality of our investment portfolio and accounts receivable, as well as future economic conditions.
Leases: In February 2016, the FASB issued new accounting guidance related to leases that outlines a new comprehensive lease accounting model and requires expanded disclosures (ASC 842). Under the new accounting guidance, we are required to recognize right-of-use assets and corresponding lease liabilities on the consolidated balance sheet. We adopted ASC 842 in the first quarter of fiscal 2020 using the modified retrospective approach, with the cumulative effect of initial adoption recorded as an adjustment to our opening consolidated balance sheet at September 30, 2019. We elected to not record leases with
Free historical financial statements for QUALCOMM Inc.. See how revenue, income, cash flow, and balance sheet financials have changed over 66 quarters since 2009. Compare with QCOM stock chart to see long term trends.
Data imported from QUALCOMM Inc. SEC filings. Check original filings before making any investment decision.