Technology › Semiconductors And Related Devices

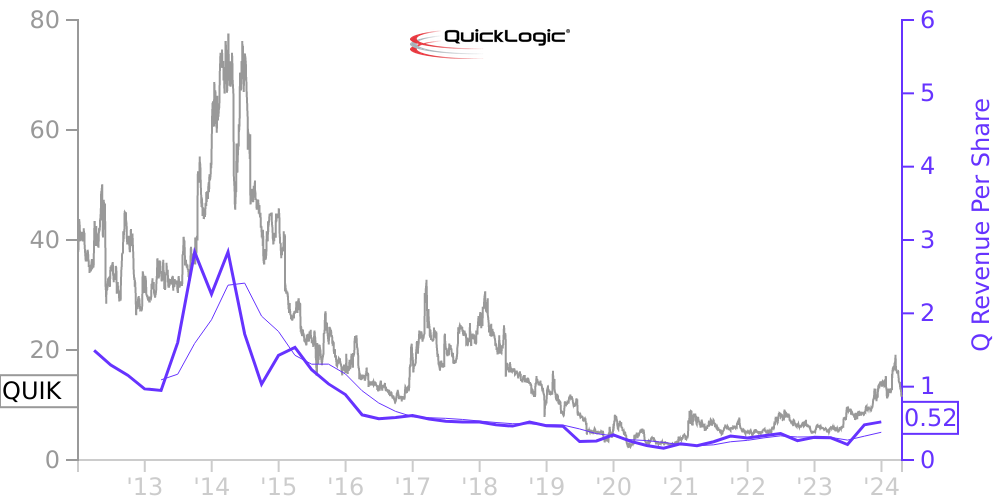
QUIK Stock Price Correlated With QuickLogic Financials
External Links ⌄
Income Statement
Cash Flow
Balance Sheet
QUIK Income Statement
Enable JavaScript and reload
Revenue, Net:
Cost of Goods & Services Sold:
Gross Profit:
Selling, General & Admin Expense:
Research & Development Expense:
Total Operating Expenses:
Operating Income:
Income Taxes:
Net Income:
QUIK Cash Flow
Enable JavaScript and reload
Operating Activities Net Income:
Depreciation, Depletion & Amortization:
Change in Accounts Receiveable:
Net Cash from Operations:
Repurchases/Buybacks Common Stock:
Issuance of Long-term Debt:
Cash Dividends Paid:
Net Cash from Financing Activities:
Property, Plant & Equipment Purchases:
Purchases of Businesses, Net of Cash:
Net Cash from Investing Activities:
Net Change in Cash & Equivalents:
QUIK Balance Sheet
Enable JavaScript and reload
Cash and Cash Equivalents:
Short-Term Investments:
Accounts Receivable, Net:
Inventories:
Total Current Assets:
Property, Plant & Equipment, Net:
Total Assets:
Accounts Payable:
Current Portion of Long-Term Debt:
Total Short-Term Liabilities:
Long Term Debt, Non-Current Portion:
Total Long-Term Liabilities:
Total Liabilities:
COMPANY PROFILE
NOTE 1 -THE COMPANY AND BASIS OF PRESENTATION
QuickLogic Corporation ("QuickLogic" or, the "Company"), was founded in 1988 and reincorporated in Delaware in 1999. The Company enables Original Equipment Manufacturers "(OEMs"), to maximize battery life for highly differentiated, immersive user experiences with Smartphone, Wearable, Hearable, Tablet and Internet-of-Things or IoT devices, Military, Aerospace and Defense products. QuickLogic delivers these benefits through industry leading ultra-low power customer programmable System on Chip or SoC semiconductor solutions, embedded software, and algorithm solutions for always-on voice and sensor processing. The Company is a fabless semiconductor provider of comprehensive, flexible sensor processing solutions, ultra-low power display bridges, and ultra-low power Field Programmable Gate Arrays"(FPGAs"). The Company’s wholly owned subsidiary, SensiML Corporation, or SensiML, provides Analytics Toolkit, which is used in many of the applications where the Company’s ArcticPro™, eFPGA intellectual property "(IP") plays a critical role. SensiML Analytics toolkit is an end-to-end software suite that provides OEMs a straightforward process for developing pattern matching sensor algorithms using machine learning technology that are optimized for ultra-low power consumption.
QuickLogic’s fiscal year ends on the Sunday closest to December 31. Fiscal years 2021, 2020 and 2019 ended on January 2, 2022, January 3, 2021 and December 29, 2019, respectively.
COVID- 19 - Impact on Business
On January 30, 2020, the World Health Organization (“WHO”) declared a global emergency due to the COVID- 19 pandemic, and on February 28, 2020, the WHO raised its assessment of the threat from high to very high at a global level. The social and economic impact of the COVID- 19 outbreak has continued to increase exponentially since this declaration. The outbreak has resulted in significant governmental measures being implemented to control the spread of COVID- 19 and countries across the world continue to manage repeated waves of the pandemic, including variant strains of COVID- 19 amid increasing, yet uneven progress toward vaccination. Restrictions on travel, business operations and the movement of people in many regions of the world in which the Company operates, and the imposition of further shelter-in-place or similarly restrictive work-from-home orders would impact many of the Company’s offices and employees, including those located in the United States. As a result, the Company has substantially limited the presence of personnel in its offices in several impacted locations, implemented travel restrictions and withdrawn from various industry events. The Company has also experienced some disruption and delays in its supply chain, customer deployment plans, and logistics challenges, including certain limitations on its ability to access customer fulfillment and service sites.
As such, while COVID- 19 has had an impact on the Company's financial results on the three and twelve months ended January 2, 2022, the COVID- 19 pandemic and its potential effects on the Company’s business in its fiscal 2022 remain dynamic, and the broader implications for its business and future results of operations remain uncertain and cannot be predicted. These implications could include further disruptions or restrictions on the Company’s ability to source, manufacture or distribute its products, including temporary disruptions to the facilities of its contract manufacturers in China, Taiwan, Philippines and Singapore, or the facilities of its suppliers and their contract manufacturers globally. Additionally, multiple countries have imposed and may further impose restrictions on business operations and movement of people and products to limit the spread of COVID- 19. Delays in production or delivery of components or raw materials that are part of the Company’s global supply chain due to restrictions imposed to limit the spread of
Free historical financial statements for QuickLogic Corp.. See how revenue, income, cash flow, and balance sheet financials have changed over 57 quarters since 2012. Compare with QUIK stock chart to see long term trends.
Data imported from QuickLogic Corp. SEC filings. Check original filings before making any investment decision.