Industrials › Railroad Equipment

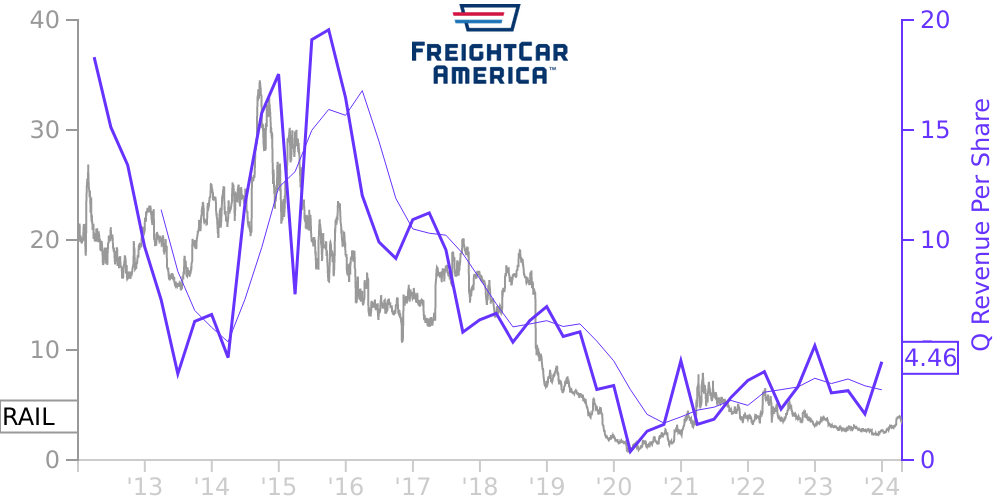
RAIL Stock Price Correlated With FreightCar America Financials
External Links ⌄
Income Statement
Cash Flow
Balance Sheet
RAIL Income Statement
Enable JavaScript and reload
Revenue, Net:
Cost of Goods & Services Sold:
Gross Profit:
Selling, General & Admin Expense:
Research & Development Expense:
Total Operating Expenses:
Operating Income:
Income Taxes:
Net Income:
RAIL Cash Flow
Enable JavaScript and reload
Operating Activities Net Income:
Depreciation, Depletion & Amortization:
Change in Accounts Receiveable:
Net Cash from Operations:
Repurchases/Buybacks Common Stock:
Issuance of Long-term Debt:
Cash Dividends Paid:
Net Cash from Financing Activities:
Property, Plant & Equipment Purchases:
Purchases of Businesses, Net of Cash:
Net Cash from Investing Activities:
Net Change in Cash & Equivalents:
RAIL Balance Sheet
Enable JavaScript and reload
Cash and Cash Equivalents:
Short-Term Investments:
Accounts Receivable, Net:
Inventories:
Total Current Assets:
Property, Plant & Equipment, Net:
Total Assets:
Accounts Payable:
Current Portion of Long-Term Debt:
Total Short-Term Liabilities:
Long Term Debt, Non-Current Portion:
Total Long-Term Liabilities:
Total Liabilities:
COMPANY PROFILE
Note 2 – Basis of Presentation The accompanying condensed consolidated financial statements include the accounts of FreightCar America, Inc. and its subsidiaries. All intercompany accounts and transactions have been eliminated in consolidation. The foregoing financial information has been prepared in accordance with the accounting principles generally accepted in the United States of America (“GAAP”) and rules and regulations of the U.S. Securities and Exchange Commission (the “SEC”) for interim financial reporting. The preparation of the financial statements in accordance with GAAP requires management to make estimates and assumptions that affect the amounts reported in the financial statements and accompanying notes. Actual results could differ from these estimates. The results of operations for the three months ended March 31, 2022 are not necessarily indicative of the results to be expected for the full year. The accompanying interim financial information is unaudited; however, the Company believes the financial information reflects all adjustments (consisting of items of a normal recurring nature) necessary for a fair presentation of financial position, results of operations and cash flows in conformity with GAAP. The 2021 year-end balance sheet data was derived from the audited financial statements as of December 31, 2021. Certain information and note disclosures normally included in the Company’s annual financial statements prepared in accordance with GAAP have been condensed or omitted. These interim financial statements should be read in conjunction with the audited financial statements contained in the Company’s annual report on Form 10-K for the year ended December 31, 2021.
Free historical financial statements for FreightCar America Inc.. See how revenue, income, cash flow, and balance sheet financials have changed over 57 quarters since 2012. Compare with RAIL stock chart to see long term trends.
Data imported from FreightCar America Inc. SEC filings. Check original filings before making any investment decision.