Industrials › Services-Help Supply Services

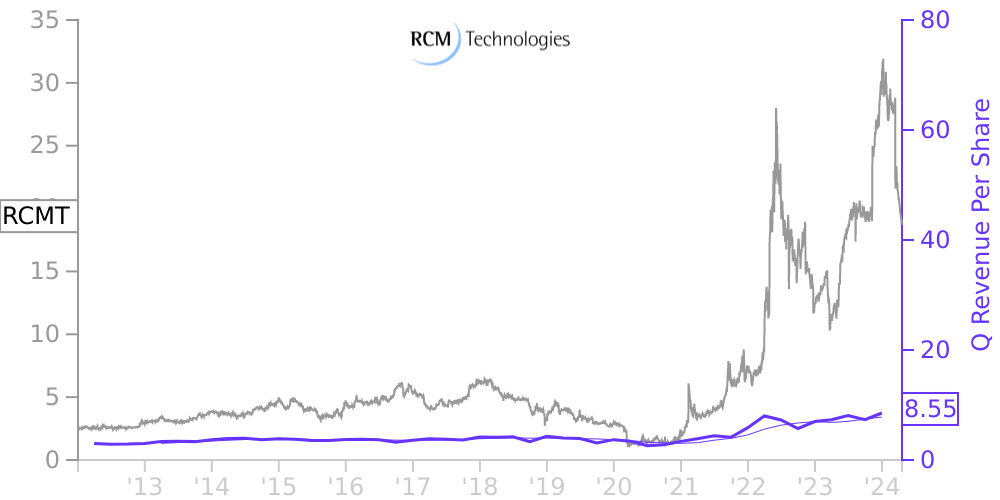
RCMT Stock Price Correlated With RCM Technologies Financials
External Links ⌄
Income Statement
Cash Flow
Balance Sheet
RCMT Income Statement
Enable JavaScript and reload
Revenue, Net:
Cost of Goods & Services Sold:
Gross Profit:
Selling, General & Admin Expense:
Research & Development Expense:
Total Operating Expenses:
Operating Income:
Income Taxes:
Net Income:
RCMT Cash Flow
Enable JavaScript and reload
Operating Activities Net Income:
Depreciation, Depletion & Amortization:
Change in Accounts Receiveable:
Net Cash from Operations:
Repurchases/Buybacks Common Stock:
Issuance of Long-term Debt:
Cash Dividends Paid:
Net Cash from Financing Activities:
Property, Plant & Equipment Purchases:
Purchases of Businesses, Net of Cash:
Net Cash from Investing Activities:
Net Change in Cash & Equivalents:
RCMT Balance Sheet
Enable JavaScript and reload
Cash and Cash Equivalents:
Short-Term Investments:
Accounts Receivable, Net:
Inventories:
Total Current Assets:
Property, Plant & Equipment, Net:
Total Assets:
Accounts Payable:
Current Portion of Long-Term Debt:
Total Short-Term Liabilities:
Long Term Debt, Non-Current Portion:
Total Long-Term Liabilities:
Total Liabilities:
COMPANY PROFILE
1. SUMMARY OF SIGNIFICANT ACCOUNTING POLICIES
Description of Business and Basis of Presentation RCM Technologies, Inc. (the “Company” or “RCM”) is a premier provider of business and technology solutions designed to enhance and maximize the operational performance of its customers through the adaptation and deployment of advanced engineering, life sciences and information technology services. Additionally, the Company provides specialty health care staffing services through its Specialty Health Care Services group. RCM’s offices are primarily located in major metropolitan centers throughout North America. The consolidated financial statements are comprised of the accounts of the Company and its wholly owned subsidiaries. All significant intercompany accounts and transactions have been eliminated in consolidation.
Cash and Cash Equivalents The Company considers its holdings of highly liquid money-market instruments and certificates of deposits to be cash equivalents if the securities mature within 90 days from the date of acquisition. These investments are carried at cost, which approximates fair value. The Company’s cash balances are maintained in accounts held by major banks and financial institutions. The majority of these balances may exceed federally insured amounts. The Company held $21 and $42 of cash and cash equivalents in Canadian banks as of January 1, 2022 and January 2, 2021, respectively, which was held principally in Canadian dollars. The Company held $169 and $246 of cash and cash equivalents in Serbian banks as of January 1, 2022 and January 2, 2021, respectively, which was held in various currencies.
Fair Value of Financial Instruments The Company’s carrying value of financial instruments, consisting primarily of accounts receivable, transit accounts receivable, accounts payable and accrued expenses, transit accounts payable and borrowings under line of credit approximates fair value due to their liquidity or their short-term nature and the line of credit’s variable interest rate. The Company does not have derivative products in place to manage risks related to foreign currency fluctuations for its foreign operations or for interest rate changes.
Accounts Receivable and Allowance for Doubtful Accounts The Company’s accounts receivable are primarily due from trade customers. Credit is extended based on evaluation of customers’ financial condition and, generally, collateral is not required. Accounts receivable payment terms vary and are stated in the financial statements at amounts due from customers net of an allowance for doubtful accounts. Accounts outstanding longer than the payment terms are considered past due. The Company determines its allowance by considering a number of factors, including the length of time trade accounts receivable are past due, the Company’s previous loss history, the customer’s current ability to pay its obligation to the Company, and the condition of the general economy and the industry as a whole. The Company writes off accounts receivable when they become uncollectible, and payments subsequently received on such receivables previously written off are credited to bad debt expense.
Accrued and Unbilled Accounts Receivable and Work-in-Process Unbilled receivables primarily represent revenues earned whereby those services are ready to be billed as of the balance sheet ending date. Work-in-process primarily represents revenues earned under contracts which the Company is contractually precluded from invoicing until future dates as project milestones are realized. See Note 4 for further details.
Transit Accounts Receivable and Transit Accounts Payable From time to time, the Company’s Engineering segment enters into agreements to provide, among other things, construction management and engineering services. Pursuant to these agreements, the Company a) may engage subcontractors to provide construction or other services; b) typically earns a fixed percentage of the total
Free historical financial statements for RCM Technologies Inc.. See how revenue, income, cash flow, and balance sheet financials have changed over 57 quarters since 2012. Compare with RCMT stock chart to see long term trends.
Data imported from RCM Technologies Inc. SEC filings. Check original filings before making any investment decision.