Energy › Crude Petroleum And Natural Gas

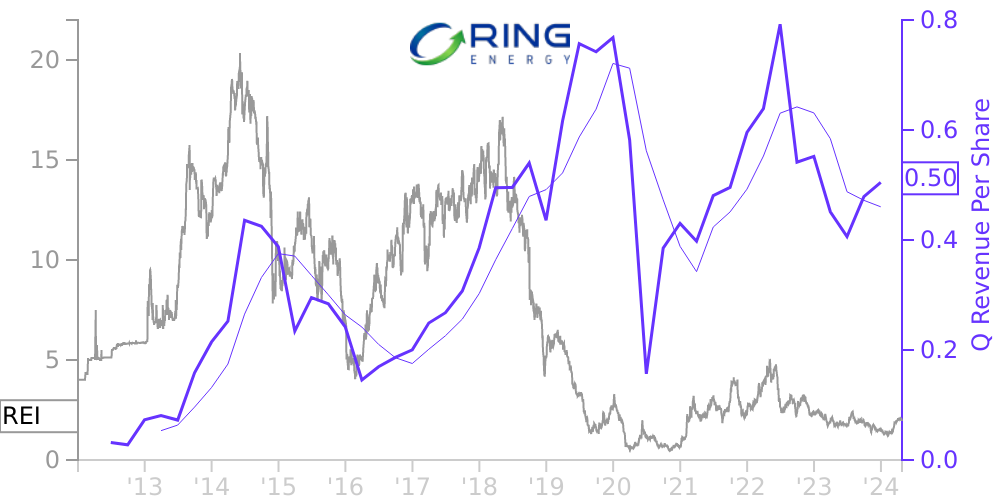
REI Stock Price Correlated With Ring Energy Financials
External Links ⌄
Income Statement
Cash Flow
Balance Sheet
REI Income Statement
Enable JavaScript and reload
Revenue, Net:
Cost of Goods & Services Sold:
Gross Profit:
Selling, General & Admin Expense:
Research & Development Expense:
Total Operating Expenses:
Operating Income:
Income Taxes:
Net Income:
REI Cash Flow
Enable JavaScript and reload
Operating Activities Net Income:
Depreciation, Depletion & Amortization:
Change in Accounts Receiveable:
Net Cash from Operations:
Repurchases/Buybacks Common Stock:
Issuance of Long-term Debt:
Cash Dividends Paid:
Net Cash from Financing Activities:
Property, Plant & Equipment Purchases:
Purchases of Businesses, Net of Cash:
Net Cash from Investing Activities:
Net Change in Cash & Equivalents:
REI Balance Sheet
Enable JavaScript and reload
Cash and Cash Equivalents:
Short-Term Investments:
Accounts Receivable, Net:
Inventories:
Total Current Assets:
Property, Plant & Equipment, Net:
Total Assets:
Accounts Payable:
Current Portion of Long-Term Debt:
Total Short-Term Liabilities:
Long Term Debt, Non-Current Portion:
Total Long-Term Liabilities:
Total Liabilities:
COMPANY PROFILE
Note 1: Basis of Presentation Interim Period - The accompanying unaudited interim financial statements of Ring Energy, Inc. (the Company) were prepared pursuant to the rules and regulations of the United States Securities and Exchange Commission (SEC). Certain information and footnote disclosures normally included in financial statements prepared in accordance with accounting principles generally accepted in the United States of America (GAAP) have been condensed or omitted pursuant to such rules and regulations. Management of the Company (Management) believes that the following disclosures are adequate to make the information presented not misleading. These financial statements should be read in conjunction with the audited financial statements and the notes thereto included in the Companys Form 10-K report for the year ended December 31, 2011. These unaudited financial statements reflect all adjustments, consisting only of normal recurring adjustments that, in the opinion of Management, are necessary to present fairly the financial position and results of operations of the Company for the periods presented. Operating results for the three months ended March 31, 2012, are not necessarily indicative of the results that may be expected for the year ending December 31, 2012. Development Stage Entity The Company is considered a development stage entity because its principal oil and gas operations are minimal and have not produced any significant revenue. Total revenue of $16,744 has been recognized since commencement of oil production, but the cost of production and the associated depreciation, depletion and amortization has resulted in a net loss from oil and gas operations of $1,633. The Company is seeking to acquire additional oil and gas properties for development. On March 1, 2012, the Company entered into a letter agreement (the "Agreement") with Patriot Royalty & Land, LLC ("Patriot Royalty") and paid $82,800 to purchase an interest in certain oil and gas leases. On May 3, 2012, the Company entered into a Stock-For-Stock Exchange Agreement with Stanford Energy, Inc., a Texas Corporation (Stanford), whereby the Company would acquire all of the issued and outstanding shares of Stanford in exchange for 3,440,000 shares of the Companys common stock. In addition, the Company agreed to assume and adopt Stanfords equity compensation plan and its outstanding options, which would represent the right to purchase up to 1,125,000 shares of the Companys common stock.
Free historical financial statements for Ring Energy Inc. See how revenue, income, cash flow, and balance sheet financials have changed over 57 quarters since 2012. Compare with REI stock chart to see long term trends.
Data imported from Ring Energy Inc SEC filings. Check original filings before making any investment decision.