
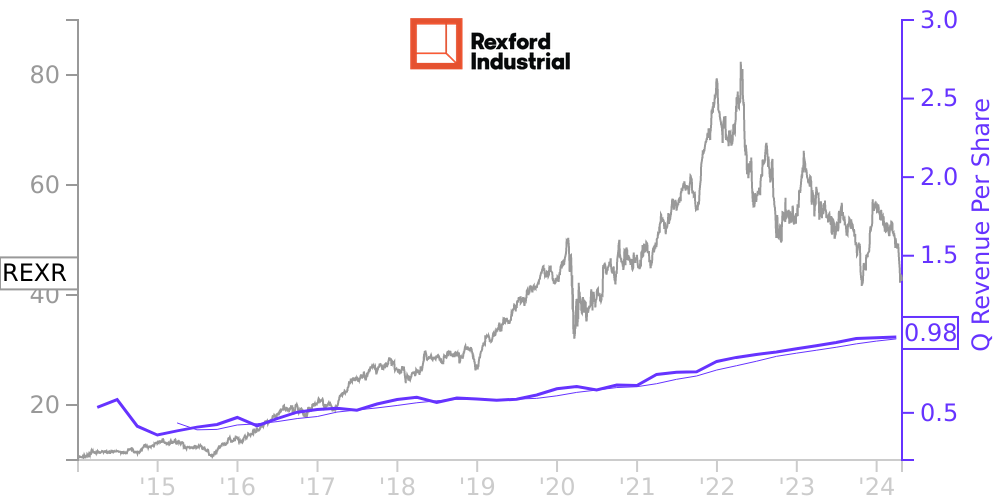
REXR Stock Price Correlated With Rexford Industrial Realty Financials
External Links ⌄
Income Statement
Cash Flow
Balance Sheet
REXR Income Statement
Enable JavaScript and reload
Revenue, Net:
Cost of Goods & Services Sold:
Gross Profit:
Selling, General & Admin Expense:
Research & Development Expense:
Total Operating Expenses:
Operating Income:
Income Taxes:
Net Income:
REXR Cash Flow
Enable JavaScript and reload
Operating Activities Net Income:
Depreciation, Depletion & Amortization:
Change in Accounts Receiveable:
Net Cash from Operations:
Repurchases/Buybacks Common Stock:
Issuance of Long-term Debt:
Cash Dividends Paid:
Net Cash from Financing Activities:
Property, Plant & Equipment Purchases:
Purchases of Businesses, Net of Cash:
Net Cash from Investing Activities:
Net Change in Cash & Equivalents:
REXR Balance Sheet
Enable JavaScript and reload
Cash and Cash Equivalents:
Short-Term Investments:
Accounts Receivable, Net:
Inventories:
Total Current Assets:
Property, Plant & Equipment, Net:
Total Assets:
Accounts Payable:
Current Portion of Long-Term Debt:
Total Short-Term Liabilities:
Long Term Debt, Non-Current Portion:
Total Long-Term Liabilities:
Total Liabilities:
COMPANY PROFILE
Total and available space by region
Los Angeles total space: 30,158,264 56.4%
Los Angeles available: 3,115,371 60.0%
Los Angeles % available 10.3 %
Inland Empire total space: 9,870,894 18.4%
Inland Empire available: 369,187 7.1%
Inland Empire % available 3.7 %
Orange County total space: 6,437,001 12.0%
Orange County available: 878,561 16.9%
Orange County % available 13.6 %
San Diego total space: 3,836,826 7.2%
San Diego available: 348,522 6.7%
San Diego % available 9.1 %
Ventura County total space: 3,211,753 6.0%
Ventura County available: 483,638 9.3%
Ventura County % available 15.1 %
REXR total space: 53,514,738
REXR total available: 5,195,279
REXR % available 9.7 %
Free historical financial statements for Rexford Industrial Realty Inc.. See how revenue, income, cash flow, and balance sheet financials have changed over 49 quarters since 2014. Compare with REXR stock chart to see long term trends.
Data imported from Rexford Industrial Realty Inc. SEC filings. Check original filings before making any investment decision.