Consumer Discretionary › Retail-Furniture Stores

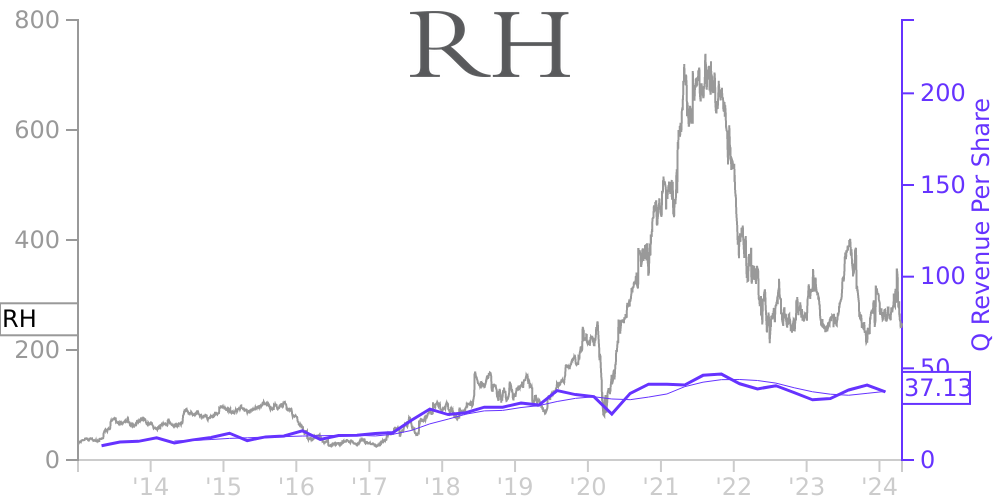
RH Stock Price Correlated With RH Financials
External Links ⌄
Income Statement
Cash Flow
Balance Sheet
RH Income Statement
Enable JavaScript and reload
Revenue, Net:
Cost of Goods & Services Sold:
Gross Profit:
Selling, General & Admin Expense:
Research & Development Expense:
Total Operating Expenses:
Operating Income:
Income Taxes:
Net Income:
RH Cash Flow
Enable JavaScript and reload
Operating Activities Net Income:
Depreciation, Depletion & Amortization:
Change in Accounts Receiveable:
Net Cash from Operations:
Repurchases/Buybacks Common Stock:
Issuance of Long-term Debt:
Cash Dividends Paid:
Net Cash from Financing Activities:
Property, Plant & Equipment Purchases:
Purchases of Businesses, Net of Cash:
Net Cash from Investing Activities:
Net Change in Cash & Equivalents:
RH Balance Sheet
Enable JavaScript and reload
Cash and Cash Equivalents:
Short-Term Investments:
Accounts Receivable, Net:
Inventories:
Total Current Assets:
Property, Plant & Equipment, Net:
Total Assets:
Accounts Payable:
Current Portion of Long-Term Debt:
Total Short-Term Liabilities:
Long Term Debt, Non-Current Portion:
Total Long-Term Liabilities:
Total Liabilities:
COMPANY PROFILE
NOTE 2—ORGANIZATION The Company was formed on August 18, 2011 and capitalized on September 2, 2011 as a holding company for the purposes of facilitating an initial public offering of common equity and was at such time a direct subsidiary of Home Holdings, LLC, a Delaware limited liability company (“Home Holdings”). On November 1, 2012, we acquired all of the outstanding shares of capital stock of Restoration Hardware, Inc., a Delaware corporation, and Restoration Hardware, Inc. became our direct, wholly owned subsidiary. Restoration Hardware, Inc. was a direct, wholly owned subsidiary of Home Holdings prior to our initial public offering. Outstanding units issued by Home Holdings under its equity compensation plan, referred to as the Team Resto Ownership Plan, were replaced with our common stock at the time of our initial public offering. These transactions are referred to as the “Reorganization.” On November 7, 2012, we completed our initial public offering. On December 15, 2016, we filed a Certificate of Amendment to our Amended and Restated Certificate of Incorporation with the Secretary of State of the State of Delaware to change our name to “RH,” effective January 1, 2017. Impact of the COVID-19 Pandemic upon our Financial Condition and Results of Operations We have experienced a significant improvement in our business during fiscal 2021 despite the ongoing challenges presented by the COVID-19 pandemic and the disruption it has caused in our business operations beginning in the first quarter of fiscal 2020 and throughout fiscal 2021. Our performance demonstrates both the desirability of our exclusive products and our ability to overcome supply chain challenges, including port delays, which have impacted our ability to convert business demand into revenues at normal historical rates. We have continued to navigate changes in operational restrictions based upon changes in local conditions and regulations, and as pandemic-related restrictions continue to be lifted in fiscal 2022 we may see consumer spending patterns shift away from spending on the home and home-related categories, such as home furnishings, and consumers return to pre-COVID consumption trends, such as spending on travel and leisure, and other activities. Our decisions regarding the sources and uses of capital in our business will continue to reflect and adapt to changes in market conditions and our business including further developments with respect to the pandemic. For more information, refer to Item 1A — Risk Factors in Part I of this Annual Report on Form 10-K.
Free historical financial statements for RH. See how revenue, income, cash flow, and balance sheet financials have changed over 51 quarters since 2013. Compare with RH stock chart to see long term trends.
Data imported from RH SEC filings. Check original filings before making any investment decision.