Consumer Discretionary › Retail-Eating Places

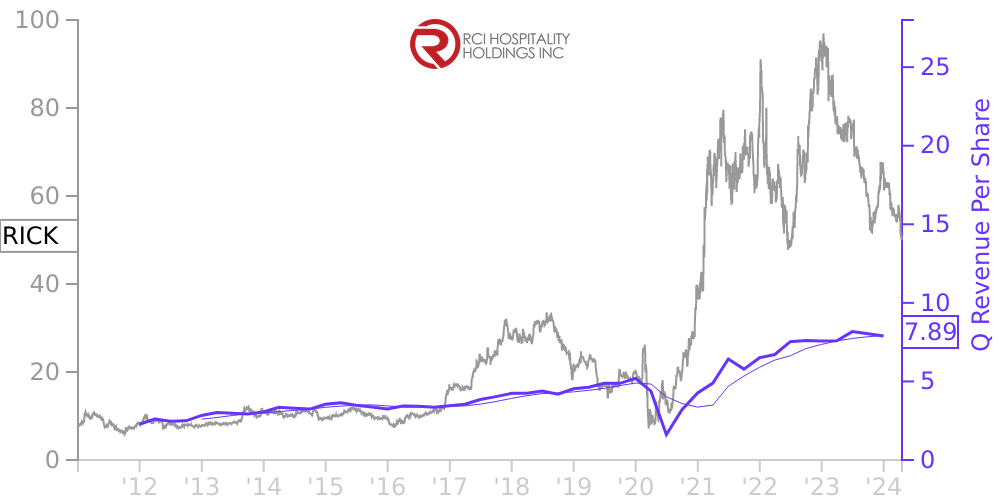
RICK Stock Price Correlated With RCI Hospitality Holdings Financials
External Links ⌄
Income Statement
Cash Flow
Balance Sheet
RICK Income Statement
Enable JavaScript and reload
Revenue, Net:
Cost of Goods & Services Sold:
Gross Profit:
Selling, General & Admin Expense:
Research & Development Expense:
Total Operating Expenses:
Operating Income:
Income Taxes:
Net Income:
RICK Cash Flow
Enable JavaScript and reload
Operating Activities Net Income:
Depreciation, Depletion & Amortization:
Change in Accounts Receiveable:
Net Cash from Operations:
Repurchases/Buybacks Common Stock:
Issuance of Long-term Debt:
Cash Dividends Paid:
Net Cash from Financing Activities:
Property, Plant & Equipment Purchases:
Purchases of Businesses, Net of Cash:
Net Cash from Investing Activities:
Net Change in Cash & Equivalents:
RICK Balance Sheet
Enable JavaScript and reload
Cash and Cash Equivalents:
Short-Term Investments:
Accounts Receivable, Net:
Inventories:
Total Current Assets:
Property, Plant & Equipment, Net:
Total Assets:
Accounts Payable:
Current Portion of Long-Term Debt:
Total Short-Term Liabilities:
Long Term Debt, Non-Current Portion:
Total Long-Term Liabilities:
Total Liabilities:
COMPANY PROFILE
1. BASIS OF PRESENTATION
The accompanying unaudited consolidated financial statements have been prepared in accordance with accounting principles generally accepted in the United States of America for interim financial information and with the instructions to Form 10-Q of Regulation S-X. They do not include all information and footnotes required by accounting principles generally accepted in the United States of America for complete financial statements. However, except as disclosed herein, there has been no material change in the information disclosed in the notes to the consolidated financial statements for the year ended September 30, 2011 included in the Company's Annual Report on Form 10-K, as filed with the Securities and Exchange Commission. The interim unaudited consolidated financial statements should be read in conjunction with those consolidated financial statements included in the Form 10-K. In the opinion of management, all adjustments considered necessary for a fair presentation, consisting solely of normal recurring adjustments, have been made. Operating results for the three months ended December 31, 2011 are not necessarily indicative of the results that may be expected for the year ending September 30, 2012.
The accompanying unaudited consolidated financial statements have been prepared in accordance with accounting principles generally accepted in the United States of America for interim financial information and with the instructions to Form 10-Q of Regulation S-X. They do not include all information and footnotes required by accounting principles generally accepted in the United States of America for complete financial statements. However, except as disclosed herein, there has been no material change in the information disclosed in the notes to the consolidated financial statements for the year ended September 30, 2011 included in the Company's Annual Report on Form 10-K, as filed with the Securities and Exchange Commission. The interim unaudited consolidated financial statements should be read in conjunction with those consolidated financial statements included in the Form 10-K. In the opinion of management, all adjustments considered necessary for a fair presentation, consisting solely of normal recurring adjustments, have been made. Operating results for the three months ended December 31, 2011 are not necessarily indicative of the results that may be expected for the year ending September 30, 2012.
Free historical financial statements for RCI Hospitality Holdings Inc.. See how revenue, income, cash flow, and balance sheet financials have changed over 58 quarters since 2011. Compare with RICK stock chart to see long term trends.
Data imported from RCI Hospitality Holdings Inc. SEC filings. Check original filings before making any investment decision.