Consumer Discretionary › Men'S And Boys' Furnishings, Work Clothing, And Allied Garments

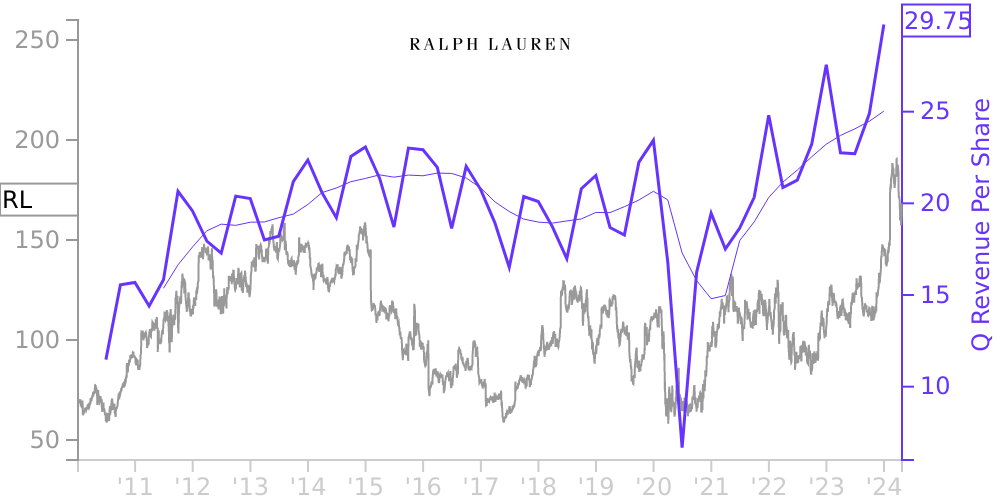
RL Stock Price Correlated With Ralph Lauren Financials
External Links ⌄
Income Statement
Cash Flow
Balance Sheet
RL Income Statement
Enable JavaScript and reload
Revenue, Net:
Cost of Goods & Services Sold:
Gross Profit:
Selling, General & Admin Expense:
Research & Development Expense:
Total Operating Expenses:
Operating Income:
Income Taxes:
Net Income:
RL Cash Flow
Enable JavaScript and reload
Operating Activities Net Income:
Depreciation, Depletion & Amortization:
Change in Accounts Receiveable:
Net Cash from Operations:
Repurchases/Buybacks Common Stock:
Issuance of Long-term Debt:
Cash Dividends Paid:
Net Cash from Financing Activities:
Property, Plant & Equipment Purchases:
Purchases of Businesses, Net of Cash:
Net Cash from Investing Activities:
Net Change in Cash & Equivalents:
RL Balance Sheet
Enable JavaScript and reload
Cash and Cash Equivalents:
Short-Term Investments:
Accounts Receivable, Net:
Inventories:
Total Current Assets:
Property, Plant & Equipment, Net:
Total Assets:
Accounts Payable:
Current Portion of Long-Term Debt:
Total Short-Term Liabilities:
Long Term Debt, Non-Current Portion:
Total Long-Term Liabilities:
Total Liabilities:
COMPANY PROFILE
Basis of Presentation Basis of Consolidation
These consolidated financial statements have been prepared in accordance with accounting principles generally accepted in the U.S. ("U.S. GAAP") and present the consolidated financial position, income (loss), comprehensive income (loss), and cash flows of the Company, including all entities in which the Company has a controlling financial interest and is determined to be the primary beneficiary. All significant intercompany balances and transactions have been eliminated in consolidation.
Fiscal Year
The Company utilizes a 52-53 week fiscal year ending on the Saturday immediately before or after March 31. As such, fiscal year 2021 ended on March 27, 2021 and was a 52-week period ("Fiscal 2021"); fiscal year 2020 ended on March 28, 2020 and was a 52-week period ("Fiscal 2020"); fiscal year 2019 ended on March 30, 2019 and was a 52-week period ("Fiscal 2019"); and fiscal year 2022 will end on April 2, 2022 and will be a 53-week period ("Fiscal 2022").
Use of Estimates
The preparation of financial statements in conformity with U.S. GAAP requires management to make certain estimates and assumptions that affect the amounts reported in the financial statements and notes thereto. Actual results could differ materially from those estimates.
Significant estimates inherent in the preparation of the consolidated financial statements include reserves for bad debt, customer returns, discounts, end-of-season markdowns, operational chargebacks, and certain cooperative advertising allowances; the realizability of inventory; reserves for litigation and other contingencies; useful lives and impairments of long-lived tangible and intangible assets; fair value measurements; accounting for income taxes and related uncertain tax positions; valuation of stock-based compensation awards and related forfeiture rates; and reserves for restructuring activity, among others.
Reclassifications
Certain reclassifications have been made to the prior periods' financial information in order to conform to the current period's presentation.
COVID-19 Pandemic
Beginning in the fourth quarter of Fiscal 2020, a novel strain of coronavirus commonly referred to as COVID-19 emerged and spread rapidly across the globe, including throughout all major geographies in which the Company operates (North America, Europe, and Asia), resulting in adverse economic conditions and business disruptions, as well as significant volatility in global financial markets. Governments worldwide have imposed varying degrees of preventative and protective actions, such as temporary travel bans, forced business closures, and stay-at-home orders, all in an effort to reduce the spread of the virus. Such factors, among others, have resulted in a significant decline in retail traffic, tourism, and consumer spending on discretionary items. Additionally, during this period of uncertainty, companies across a wide array of industries have implemented various initiatives to reduce operating expenses and preserve cash balances, including work furloughs, reduced pay, and severance actions, which could lower consumers' disposable income levels or willingness to purchase discretionary items. Further, even after such government restrictions and company initiatives are lifted, consumer behavior, spending levels, and/or shopping preferences, such as willingness to congregate in indoor shopping centers or other populated locations, could be adversely affected.
As a result of the COVID-19 pandemic, the Company has experienced varying degrees of business disruptions and periods of closure of its stores, distribution centers, and corporate facilities, as have the Company's wholesale customers, licensing partners, suppliers, and vendors. During the first quarter of Fiscal 2021, the majority of the Company's stores in key markets were closed for an average of 8 to 10 weeks due to government-mandated lockdowns and other restrictions, resulting in significant adver
Free historical financial statements for Ralph Lauren Corp. See how revenue, income, cash flow, and balance sheet financials have changed over 64 quarters since 2010. Compare with RL stock chart to see long term trends.
Data imported from Ralph Lauren Corp SEC filings. Check original filings before making any investment decision.