Industrials › Steel Works, Blast Furnaces And Rolling And Finishing Mills

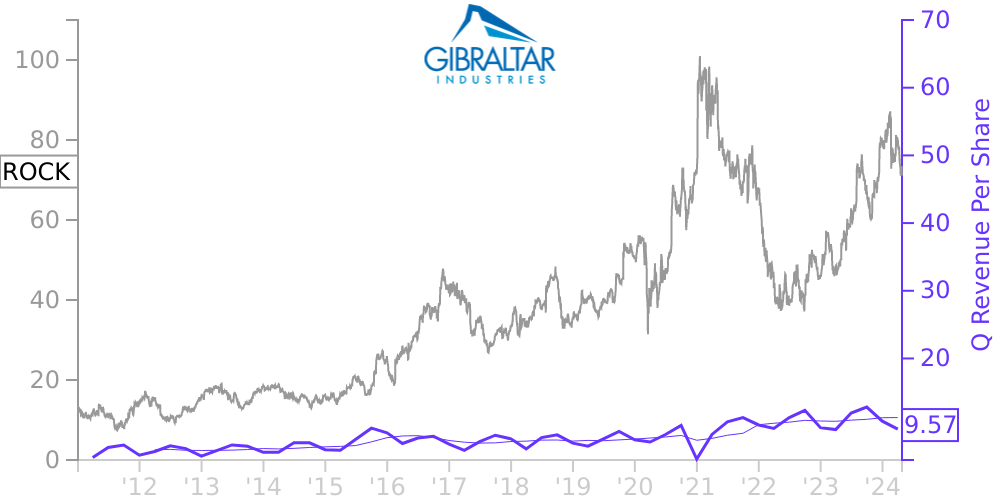
ROCK Stock Price Correlated With Gibraltar Industries Financials
External Links ⌄
Income Statement
Cash Flow
Balance Sheet
ROCK Income Statement
Enable JavaScript and reload
Revenue, Net:
Cost of Goods & Services Sold:
Gross Profit:
Selling, General & Admin Expense:
Research & Development Expense:
Total Operating Expenses:
Operating Income:
Income Taxes:
Net Income:
ROCK Cash Flow
Enable JavaScript and reload
Operating Activities Net Income:
Depreciation, Depletion & Amortization:
Change in Accounts Receiveable:
Net Cash from Operations:
Repurchases/Buybacks Common Stock:
Issuance of Long-term Debt:
Cash Dividends Paid:
Net Cash from Financing Activities:
Property, Plant & Equipment Purchases:
Purchases of Businesses, Net of Cash:
Net Cash from Investing Activities:
Net Change in Cash & Equivalents:
ROCK Balance Sheet
Enable JavaScript and reload
Cash and Cash Equivalents:
Short-Term Investments:
Accounts Receivable, Net:
Inventories:
Total Current Assets:
Property, Plant & Equipment, Net:
Total Assets:
Accounts Payable:
Current Portion of Long-Term Debt:
Total Short-Term Liabilities:
Long Term Debt, Non-Current Portion:
Total Long-Term Liabilities:
Total Liabilities:
COMPANY PROFILE
CONSOLIDATED FINANCIAL STATEMENTS The accompanying unaudited consolidated financial statements of Gibraltar Industries, Inc. (the "Company") have been prepared by management in accordance with U.S. generally accepted accounting principles for interim financial information and with the instructions to Form 10-Q and Article 10 of Regulation S-X. In the opinion of management, all adjustments consisting of normal recurring adjustments considered necessary for the fair presentation of results for the interim period have been included. The Company's operations are seasonal; for this and other reasons, such as the impact of the COVID-19 pandemic, financial results for any interim period are not necessarily indicative of the results expected for any subsequent interim period or for the full year. The accompanying unaudited consolidated financial statements should be read in conjunction with the financial statements and notes thereto included in our annual report on Form 10-K for the year ended December 31, 2021.
The balance sheet at December 31, 2021 has been derived from the audited financial statements at that date, but does not include all of the information and footnotes required by U.S. generally accepted accounting principles for complete financial statements.
The balance sheet at December 31, 2021 has been derived from the audited financial statements at that date, but does not include all of the information and footnotes required by U.S. generally accepted accounting principles for complete financial statements.
Free historical financial statements for Gibraltar Industries Inc. See how revenue, income, cash flow, and balance sheet financials have changed over 61 quarters since 2011. Compare with ROCK stock chart to see long term trends.
Data imported from Gibraltar Industries Inc SEC filings. Check original filings before making any investment decision.