Technology › Industrial Instruments For Measurement, Display, And Control

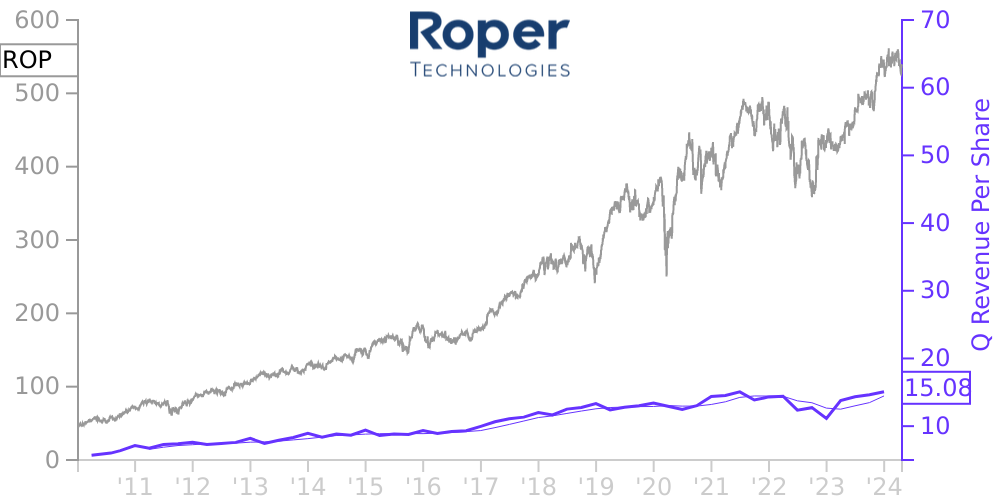
ROP Stock Price Correlated With Roper Technologies Financials
External Links ⌄
Income Statement
Cash Flow
Balance Sheet
ROP Income Statement
Enable JavaScript and reload
Revenue, Net:
Cost of Goods & Services Sold:
Gross Profit:
Selling, General & Admin Expense:
Research & Development Expense:
Total Operating Expenses:
Operating Income:
Income Taxes:
Net Income:
ROP Cash Flow
Enable JavaScript and reload
Operating Activities Net Income:
Depreciation, Depletion & Amortization:
Change in Accounts Receiveable:
Net Cash from Operations:
Repurchases/Buybacks Common Stock:
Issuance of Long-term Debt:
Cash Dividends Paid:
Net Cash from Financing Activities:
Property, Plant & Equipment Purchases:
Purchases of Businesses, Net of Cash:
Net Cash from Investing Activities:
Net Change in Cash & Equivalents:
ROP Balance Sheet
Enable JavaScript and reload
Cash and Cash Equivalents:
Short-Term Investments:
Accounts Receivable, Net:
Inventories:
Total Current Assets:
Property, Plant & Equipment, Net:
Total Assets:
Accounts Payable:
Current Portion of Long-Term Debt:
Total Short-Term Liabilities:
Long Term Debt, Non-Current Portion:
Total Long-Term Liabilities:
Total Liabilities:
COMPANY PROFILE
Basis of Presentation The accompanying Condensed Consolidated Financial Statements for the three months ended March 31, 2022 and 2021 are unaudited. In the opinion of management, the accompanying unaudited Condensed Consolidated Financial Statements reflect all adjustments, which include only normal recurring adjustments, necessary to state fairly the financial position, results of operations, comprehensive income and cash flows of Roper Technologies, Inc. and its subsidiaries (“Roper,” the “Company,” “we,” “our” or “us”) for all periods presented. The December 31, 2021 financial position data included herein was derived from the audited consolidated financial statements included in the Company’s 2021 Annual Report on Form 10-K (“Annual Report”) filed on February 22, 2022 with the Securities and Exchange Commission (“SEC”) but does not include all disclosures required by U.S. generally accepted accounting principles (“GAAP”).
Roper’s management has made estimates and assumptions relating to the reporting of assets and liabilities and the disclosure of contingent assets and liabilities to prepare these Condensed Consolidated Financial Statements in conformity with GAAP. Actual results could differ from those estimates.
During 2021, the Company signed definitive agreements to divest our TransCore, Zetec and CIVCO Radiotherapy businesses. As of March 31, 2022, Roper has completed all three divestitures. The financial results for these businesses are presented as discontinued operations for all periods presented. Unless otherwise noted, discussion within these notes to the Condensed Consolidated Financial Statements relate to continuing operations. Refer to Note 5 for additional information on discontinued operations.
The results of operations for the three months ended March 31, 2022 are not necessarily indicative of the results to be expected for the full year. You should read these unaudited Condensed Consolidated Financial Statements in conjunction with Roper’s audited consolidated financial statements and the notes thereto included in its Annual Report. Certain prior period amounts have been reclassified to conform to current period presentation.
Free historical financial statements for Roper Technologies Inc. See how revenue, income, cash flow, and balance sheet financials have changed over 65 quarters since 2010. Compare with ROP stock chart to see long term trends.
Data imported from Roper Technologies Inc SEC filings. Check original filings before making any investment decision.