
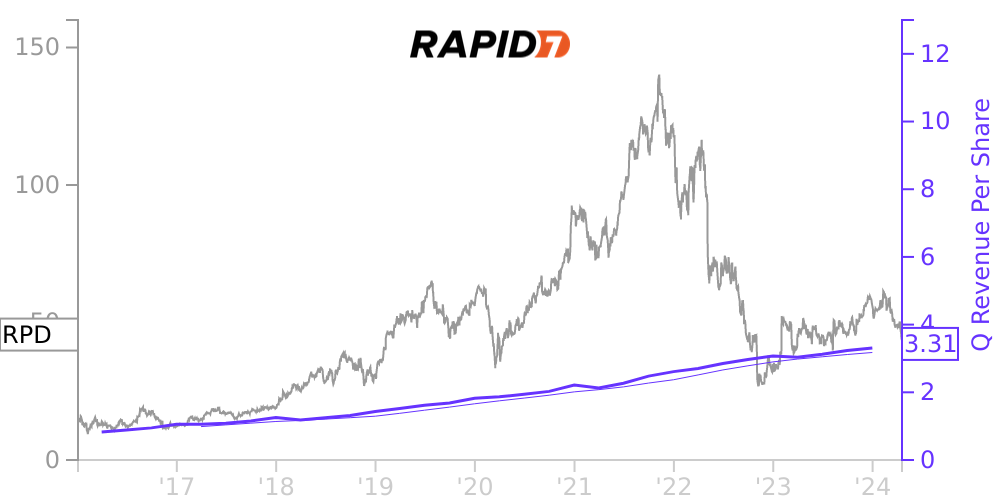
RPD Stock Price Correlated With Rapid7 Financials
External Links ⌄
Income Statement
Cash Flow
Balance Sheet
RPD Income Statement
Enable JavaScript and reload
Revenue, Net:
Cost of Goods & Services Sold:
Gross Profit:
Selling, General & Admin Expense:
Research & Development Expense:
Total Operating Expenses:
Operating Income:
Income Taxes:
Net Income:
RPD Cash Flow
Enable JavaScript and reload
Operating Activities Net Income:
Depreciation, Depletion & Amortization:
Change in Accounts Receiveable:
Net Cash from Operations:
Repurchases/Buybacks Common Stock:
Issuance of Long-term Debt:
Cash Dividends Paid:
Net Cash from Financing Activities:
Property, Plant & Equipment Purchases:
Purchases of Businesses, Net of Cash:
Net Cash from Investing Activities:
Net Change in Cash & Equivalents:
RPD Balance Sheet
Enable JavaScript and reload
Cash and Cash Equivalents:
Short-Term Investments:
Accounts Receivable, Net:
Inventories:
Total Current Assets:
Property, Plant & Equipment, Net:
Total Assets:
Accounts Payable:
Current Portion of Long-Term Debt:
Total Short-Term Liabilities:
Long Term Debt, Non-Current Portion:
Total Long-Term Liabilities:
Total Liabilities:
COMPANY PROFILE
Description of Business, Basis of Presentation and Consolidation and Significant Accounting Policies Description of Business
Rapid7, Inc. and subsidiaries (“we,” “us” or “our”) are advancing security with visibility, analytics, and automation delivered through our Insight Platform. Our solutions simplify the complex, allowing security teams to work more effectively with IT and development to reduce vulnerabilities, monitor for malicious behavior, investigate and shut down attacks, and automate routine tasks.
Basis of Presentation and Consolidation
The accompanying unaudited consolidated financial statements have been prepared by us in accordance with accounting principles generally accepted in the United States of America (“GAAP”), as well as pursuant to the rules and regulations of the Securities and Exchange Commission (“SEC”), regarding interim financial reporting. Accordingly, certain information and note disclosures normally included in the financial statements prepared in accordance with GAAP have been condensed or omitted pursuant to such rules and regulations. These consolidated financial statements should be read in conjunction with the consolidated financial statements and related notes included in our Annual Report on Form 10-K for the year ended December 31, 2021 filed with the SEC on February 24, 2022.
The consolidated financial statements include our results of operations and those of our wholly-owned subsidiaries and reflect all adjustments (consisting solely of normal, recurring adjustments) which are, in the opinion of management, necessary for a fair statement of results for the interim periods presented. All intercompany transactions and balances have been eliminated in consolidation. The results of operations for the three and six months ended June 30, 2022 are not necessarily indicative of the results to be expected for any future period or the entire fiscal year.
Use of Estimates
The preparation of consolidated financial statements in conformity with GAAP requires management to make estimates, judgments and assumptions that affect the amounts reported in the consolidated financial statements and accompanying notes. The management estimates include, but are not limited to the determination of the estimated economic life of perpetual licenses for revenue recognition, the determination of standalone selling prices in revenue transactions with multiple performance obligations, the estimated period of benefit for deferred contract acquisition and fulfillment costs, the useful lives and recoverability of long-lived assets, the valuation for credit losses, the valuation of stock-based compensation, the fair value of assets acquired and liabilities assumed in business combinations, the incremental borrowing rate for operating leases and the valuation for deferred tax assets. We base our estimates on historical experience and on various other assumptions that we believe are reasonable. Actual results could differ from those estimates.
The COVID-19 pandemic has resulted in a sustained global slowdown of economic activity that has decreased demand for a broad variety of goods and services, including from our customers. While we have not experienced significant disruptions from the COVID-19 pandemic during the three and six months ended June 30, 2022, we are unable to accurately predict the extent to which the ongoing COVID-19 pandemic may impact our business, results of operations and financial condition going forward. Estimates and assumptions about future events and their effects cannot be determined with certainty and therefore require the exercise of judgment. As of the date of issuance of these financial statements, we are not aware of any specific event or circumstance that would require us to update our estimates, assumptions and judgments or revise the carrying value of our assets or liabilities. These estimates may change as new events occur and additional information is obtained and will be recogni
Free historical financial statements for Rapid7 Inc. See how revenue, income, cash flow, and balance sheet financials have changed over 41 quarters since 2016. Compare with RPD stock chart to see long term trends.
Data imported from Rapid7 Inc SEC filings. Check original filings before making any investment decision.