Materials › Paints, Varnishes, Lacquers, Enamels And Allied Products

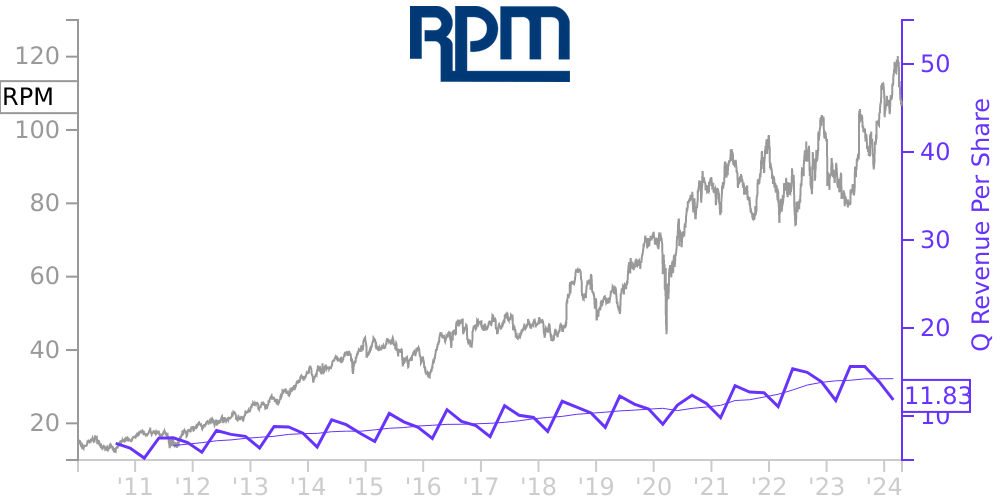
RPM Stock Price Correlated With RPM International Financials
External Links ⌄
Income Statement
Cash Flow
Balance Sheet
RPM Income Statement
Enable JavaScript and reload
Revenue, Net:
Cost of Goods & Services Sold:
Gross Profit:
Selling, General & Admin Expense:
Research & Development Expense:
Total Operating Expenses:
Operating Income:
Income Taxes:
Net Income:
RPM Cash Flow
Enable JavaScript and reload
Operating Activities Net Income:
Depreciation, Depletion & Amortization:
Change in Accounts Receiveable:
Net Cash from Operations:
Repurchases/Buybacks Common Stock:
Issuance of Long-term Debt:
Cash Dividends Paid:
Net Cash from Financing Activities:
Property, Plant & Equipment Purchases:
Purchases of Businesses, Net of Cash:
Net Cash from Investing Activities:
Net Change in Cash & Equivalents:
RPM Balance Sheet
Enable JavaScript and reload
Cash and Cash Equivalents:
Short-Term Investments:
Accounts Receivable, Net:
Inventories:
Total Current Assets:
Property, Plant & Equipment, Net:
Total Assets:
Accounts Payable:
Current Portion of Long-Term Debt:
Total Short-Term Liabilities:
Long Term Debt, Non-Current Portion:
Total Long-Term Liabilities:
Total Liabilities:
COMPANY PROFILE
NOTE 1 — CONSOLIDATION, NONCONTROLLING INTERESTS AND BASIS OF PRESENTATION The accompanying unaudited Consolidated Financial Statements have been prepared in accordance with Generally Accepted Accounting Principles in the U.S. (“GAAP”) for interim financial information and the instructions to Form 10-Q. In our opinion, all adjustments (consisting of normal, recurring accruals) considered necessary for a fair presentation have been included for the three-month periods ended August 31, 2022, and August 31, 2021. For further information, refer to the Consolidated Financial Statements and Notes included in our Annual Report on Form 10-K for the year ended May 31, 2022. Our financial statements include all of our majority-owned subsidiaries. We account for our investments in less-than-majority-owned joint ventures, for which we have the ability to exercise significant influence, under the equity method. Effects of transactions between related companies are eliminated in consolidation. Noncontrolling interests are presented in our Consolidated Financial Statements as if parent company investors (controlling interests) and other minority investors (noncontrolling interests) in partially-owned subsidiaries have similar economic interests in a single entity. As a result, investments in noncontrolling interests are reported as equity in our Consolidated Financial Statements. Additionally, our Consolidated Financial Statements include 100 % of a controlled subsidiary’s earnings, rather than only our share. Transactions between the parent company and noncontrolling interests are reported in equity as transactions between stockholders, provided that these transactions do not create a change in control. Our business is dependent on external weather factors. Historically, we have experienced strong sales and net income in our first, second and fourth fiscal quarters comprising the three-month periods ending August 31, November 30 and May 31, respectively, with weaker performance in our third fiscal quarter (December through February).
Free historical financial statements for RPM International Inc.. See how revenue, income, cash flow, and balance sheet financials have changed over 64 quarters since 2010. Compare with RPM stock chart to see long term trends.
Data imported from RPM International Inc. SEC filings. Check original filings before making any investment decision.