Industrials › Motors And Generators

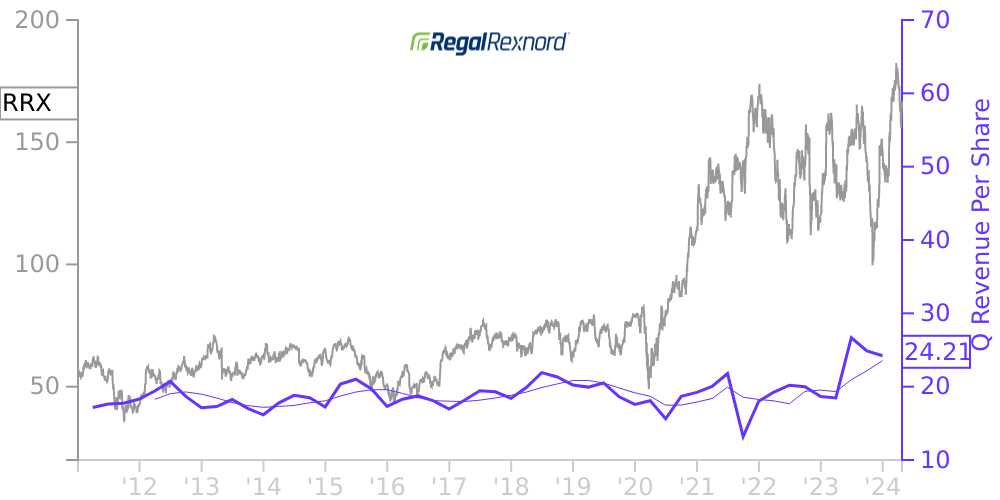
RRX Stock Price Correlated With Regal Rexnord Financials
External Links ⌄
Income Statement
Cash Flow
Balance Sheet
RRX Income Statement
Enable JavaScript and reload
Revenue, Net:
Cost of Goods & Services Sold:
Gross Profit:
Selling, General & Admin Expense:
Research & Development Expense:
Total Operating Expenses:
Operating Income:
Income Taxes:
Net Income:
RRX Cash Flow
Enable JavaScript and reload
Operating Activities Net Income:
Depreciation, Depletion & Amortization:
Change in Accounts Receiveable:
Net Cash from Operations:
Repurchases/Buybacks Common Stock:
Issuance of Long-term Debt:
Cash Dividends Paid:
Net Cash from Financing Activities:
Property, Plant & Equipment Purchases:
Purchases of Businesses, Net of Cash:
Net Cash from Investing Activities:
Net Change in Cash & Equivalents:
RRX Balance Sheet
Enable JavaScript and reload
Cash and Cash Equivalents:
Short-Term Investments:
Accounts Receivable, Net:
Inventories:
Total Current Assets:
Property, Plant & Equipment, Net:
Total Assets:
Accounts Payable:
Current Portion of Long-Term Debt:
Total Short-Term Liabilities:
Long Term Debt, Non-Current Portion:
Total Long-Term Liabilities:
Total Liabilities:
COMPANY PROFILE
Basis of Presentation The Company operates on a 52/53 week fiscal year ending on the Saturday closest to December 31. The fiscal year ended January 1, 2022 was 52 weeks, the fiscal year ended January 2, 2021 was 53 weeks and the fiscal year ended December 28, 2019 was 52 weeks.
Effective for fiscal year 2022, the Company approved a change in the fiscal year end from a 52-53 week year ending on the Saturday closest to December 31 to a calendar year ending on December 31. The Company will make the fiscal year change on a prospective basis and will not adjust operating results for prior periods. The change to the Company’s fiscal year will not impact the Company’s results for the year ended January 1, 2022. While this change will impact the comparability of future results with each of the fiscal quarters and the annual fiscal period in 2022, the impact is not expected to be material to our quarterly or annual results.
Effective for fiscal year 2022, the Company approved a change in the fiscal year end from a 52-53 week year ending on the Saturday closest to December 31 to a calendar year ending on December 31. The Company will make the fiscal year change on a prospective basis and will not adjust operating results for prior periods. The change to the Company’s fiscal year will not impact the Company’s results for the year ended January 1, 2022. While this change will impact the comparability of future results with each of the fiscal quarters and the annual fiscal period in 2022, the impact is not expected to be material to our quarterly or annual results.
Free historical financial statements for Regal Rexnord Corp. See how revenue, income, cash flow, and balance sheet financials have changed over 61 quarters since 2011. Compare with RRX stock chart to see long term trends.
Data imported from Regal Rexnord Corp SEC filings. Check original filings before making any investment decision.