Industrials › Aircraft Engines And Engine Parts

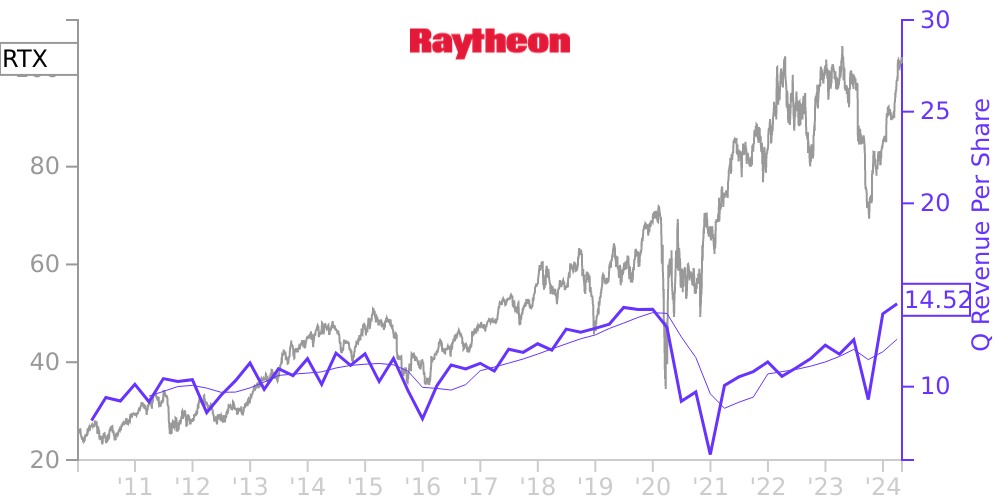
RTX Stock Price Correlated With RTX Financials
External Links ⌄
Income Statement
Cash Flow
Balance Sheet
RTX Income Statement
Enable JavaScript and reload
Revenue, Net:
Cost of Goods & Services Sold:
Gross Profit:
Selling, General & Admin Expense:
Research & Development Expense:
Total Operating Expenses:
Operating Income:
Income Taxes:
Net Income:
RTX Cash Flow
Enable JavaScript and reload
Operating Activities Net Income:
Depreciation, Depletion & Amortization:
Change in Accounts Receiveable:
Net Cash from Operations:
Repurchases/Buybacks Common Stock:
Issuance of Long-term Debt:
Cash Dividends Paid:
Net Cash from Financing Activities:
Property, Plant & Equipment Purchases:
Purchases of Businesses, Net of Cash:
Net Cash from Investing Activities:
Net Change in Cash & Equivalents:
RTX Balance Sheet
Enable JavaScript and reload
Cash and Cash Equivalents:
Short-Term Investments:
Accounts Receivable, Net:
Inventories:
Total Current Assets:
Property, Plant & Equipment, Net:
Total Assets:
Accounts Payable:
Current Portion of Long-Term Debt:
Total Short-Term Liabilities:
Long Term Debt, Non-Current Portion:
Total Long-Term Liabilities:
Total Liabilities:
COMPANY PROFILE
The Condensed Consolidated Financial Statements at March 31 , 2010 and for the quarter s ended March 31 , 2010 and 2009 are unaudited, but in the opinion of management include all adjustments (consisting only of normal recurring adjustments) necessary for a fair presentation of the results for the interim periods. The results reported in these Condensed Consolidated Financial Statements should not necessarily be taken as indicative of results that may be expected for the entire year. The financial information included herein should be read in conjunction with the financial statements and notes in our Annual Report to Shareowners ( 2009 Annual Report) incorporated by reference to our Annual Report on Form 10-K for calendar year 2009 ( 2009 Form 10-K).
Free historical financial statements for RTX Corp.. See how revenue, income, cash flow, and balance sheet financials have changed over 65 quarters since 2010. Compare with RTX stock chart to see long term trends.
Data imported from RTX Corp. SEC filings. Check original filings before making any investment decision.