Materials › Wholesale-Metals Service Centers And Offices

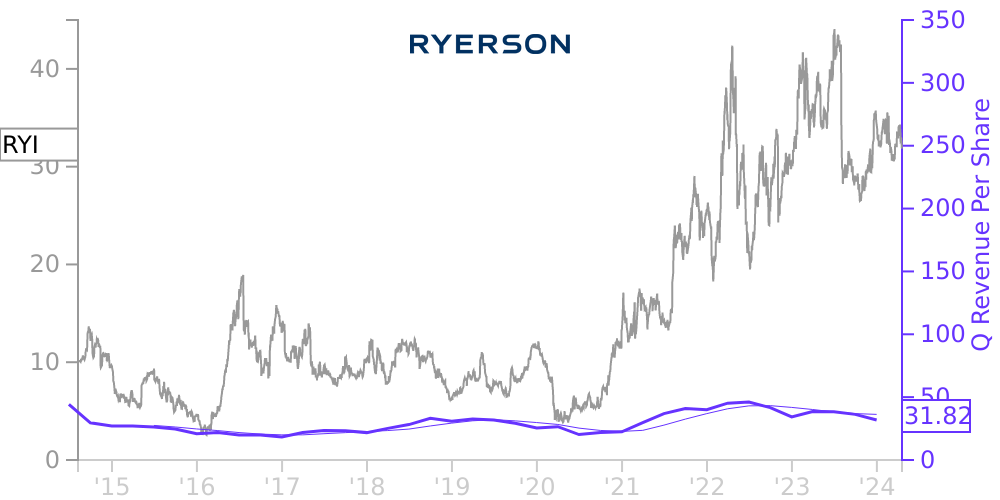
RYI Stock Price Correlated With Ryerson Holding Financials
External Links ⌄
Income Statement
Cash Flow
Balance Sheet
RYI Income Statement
Enable JavaScript and reload
Revenue, Net:
Cost of Goods & Services Sold:
Gross Profit:
Selling, General & Admin Expense:
Research & Development Expense:
Total Operating Expenses:
Operating Income:
Income Taxes:
Net Income:
RYI Cash Flow
Enable JavaScript and reload
Operating Activities Net Income:
Depreciation, Depletion & Amortization:
Change in Accounts Receiveable:
Net Cash from Operations:
Repurchases/Buybacks Common Stock:
Issuance of Long-term Debt:
Cash Dividends Paid:
Net Cash from Financing Activities:
Property, Plant & Equipment Purchases:
Purchases of Businesses, Net of Cash:
Net Cash from Investing Activities:
Net Change in Cash & Equivalents:
RYI Balance Sheet
Enable JavaScript and reload
Cash and Cash Equivalents:
Short-Term Investments:
Accounts Receivable, Net:
Inventories:
Total Current Assets:
Property, Plant & Equipment, Net:
Total Assets:
Accounts Payable:
Current Portion of Long-Term Debt:
Total Short-Term Liabilities:
Long Term Debt, Non-Current Portion:
Total Long-Term Liabilities:
Total Liabilities:
COMPANY PROFILE
NOTE 1: FINANCIAL STATEMENTS
Ryerson Holding Corporation (“Ryerson Holding”), a Delaware corporation, is the parent company of Joseph T. Ryerson & Son, Inc. (“JT Ryerson”), a Delaware corporation. Affiliates of Platinum Equity, LLC (“Platinum”) own approximately 21,037,500 shares of our common stock, which is approximately 54% of our outstanding common stock.
We are a leading value-added processor and distributor of industrial metals with operations in the United States (“U.S.”) through JT Ryerson, in Canada through our indirect wholly-owned subsidiary Ryerson Canada, Inc., a Canadian corporation (“Ryerson Canada”), and in Mexico through our indirect wholly-owned subsidiary Ryerson Metals de Mexico, S. de R.L. de C.V., a Mexican corporation (“Ryerson Mexico”). In addition to our North American operations, we conduct materials processing and distribution operations in China through an indirect wholly-owned subsidiary, Ryerson China Limited (“Ryerson China”), a Chinese limited liability company. Unless the context indicates otherwise, Ryerson Holding, JT Ryerson, Ryerson Canada, Ryerson China, and Ryerson Mexico together with their subsidiaries, are collectively referred to herein as “Ryerson,” “we,” “us,” “our,” or the “Company.”
Results of operations for any interim period are not necessarily indicative of results of any future periods or for the year. The condensed consolidated financial statements as of March 31, 2022 and for the three months ended March 31, 2022 and 2021 are unaudited, but in the opinion of management, include all adjustments, consisting of normal recurring adjustments, necessary for a fair presentation of results for such periods. The year-end condensed consolidated balance sheet data contained in this report was derived from audited financial statements, but does not include all disclosures required by U.S. generally accepted accounting principles (“GAAP”). These condensed consolidated financial statements should be read in conjunction with the consolidated financial statements and related notes contained in the Company’s Annual Report on Form 10-K for the year ended December 31, 2021.
Free historical financial statements for Ryerson Holding Corp. See how revenue, income, cash flow, and balance sheet financials have changed over 48 quarters since 2014. Compare with RYI stock chart to see long term trends.
Data imported from Ryerson Holding Corp SEC filings. Check original filings before making any investment decision.