Technology › Printed Circuit Boards

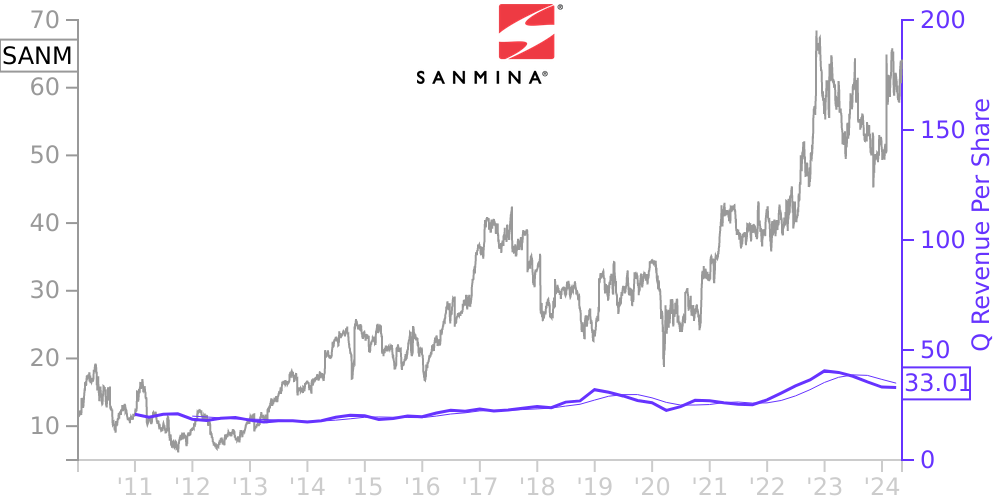
SANM Stock Price Correlated With Sanmina Financials
External Links ⌄
Income Statement
Cash Flow
Balance Sheet
SANM Income Statement
Enable JavaScript and reload
Revenue, Net:
Cost of Goods & Services Sold:
Gross Profit:
Selling, General & Admin Expense:
Research & Development Expense:
Total Operating Expenses:
Operating Income:
Income Taxes:
Net Income:
SANM Cash Flow
Enable JavaScript and reload
Operating Activities Net Income:
Depreciation, Depletion & Amortization:
Change in Accounts Receiveable:
Net Cash from Operations:
Repurchases/Buybacks Common Stock:
Issuance of Long-term Debt:
Cash Dividends Paid:
Net Cash from Financing Activities:
Property, Plant & Equipment Purchases:
Purchases of Businesses, Net of Cash:
Net Cash from Investing Activities:
Net Change in Cash & Equivalents:
SANM Balance Sheet
Enable JavaScript and reload
Cash and Cash Equivalents:
Short-Term Investments:
Accounts Receivable, Net:
Inventories:
Total Current Assets:
Property, Plant & Equipment, Net:
Total Assets:
Accounts Payable:
Current Portion of Long-Term Debt:
Total Short-Term Liabilities:
Long Term Debt, Non-Current Portion:
Total Long-Term Liabilities:
Total Liabilities:
COMPANY PROFILE
Organization of Sanmina
Sanmina Corporation (“Sanmina,” or the “Company”) was incorporated in Delaware in 1989. The Company is a leading global provider of integrated manufacturing solutions, components, products and repair, logistics and after-market services. The Company provides these comprehensive solutions primarily to original equipment manufacturers (OEMs) that serve the industrial, medical, defense and aerospace, automotive, communications networks and cloud solutions industries.
The Company's operations are managed as two businesses:
1) Integrated Manufacturing Solutions (IMS). IMS is a single operating segment consisting of printed circuit board assembly and test, high-level assembly and test and direct-order-fulfillment.
2) Components, Products and Services (CPS). Components include interconnect systems (printed circuit board fabrication, backplanes, cable assemblies and plastic injection molding) and mechanical systems (enclosures and precision machining). Products include memory solutions from our Viking Technology division; high-performance storage platforms for hyperscale and enterprise solutions from our Viking Enterprise Solutions (VES) division; optical, radio frequency (RF) and microelectronic (microE) design and manufacturing services from Advanced Micro Systems Technologies; defense and aerospace products from SCI Technology; and cloud-based manufacturing execution software from the Company's 42Q division. Services include design, engineering and logistics and repair.
The Company's only reportable segment is IMS, which represented approximately 80% of total revenue in 2021. The CPS business consists of multiple operating segments which do not individually meet the quantitative thresholds for being presented as reportable segments. Therefore, financial information for these operating segments is aggregated and presented in a single category entitled “Components, Products and Services”.
Basis of Presentation
Fiscal Year. The Company operates on a 52 or 53 week year ending on the Saturday nearest September 30. Fiscal 2021 and 2019 were each 52 weeks and fiscal 2020 was a 53-week year, with the extra week occurring during the fourth quarter of fiscal 2020. All references to years relate to fiscal years unless otherwise noted.
Principles of Consolidation. The consolidated financial statements include the Company's accounts and those of its subsidiaries. All intercompany balances and transactions have been eliminated.
Free historical financial statements for Sanmina Corp. See how revenue, income, cash flow, and balance sheet financials have changed over 63 quarters since 2010. Compare with SANM stock chart to see long term trends.
Data imported from Sanmina Corp SEC filings. Check original filings before making any investment decision.