Technology › Semiconductors And Related Devices

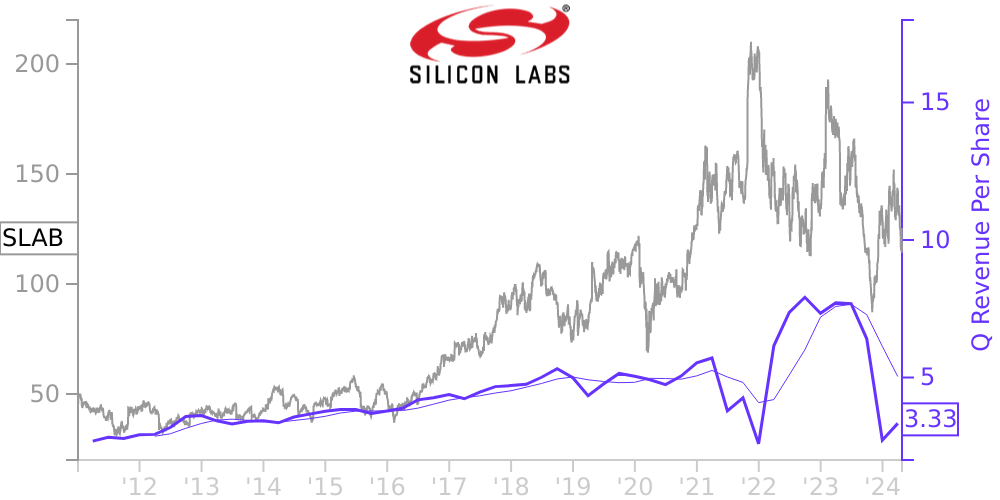
SLAB Stock Price Correlated With Silicon Laboratories Financials
External Links ⌄
Income Statement
Cash Flow
Balance Sheet
SLAB Income Statement
Enable JavaScript and reload
Revenue, Net:
Cost of Goods & Services Sold:
Gross Profit:
Selling, General & Admin Expense:
Research & Development Expense:
Total Operating Expenses:
Operating Income:
Income Taxes:
Net Income:
SLAB Cash Flow
Enable JavaScript and reload
Operating Activities Net Income:
Depreciation, Depletion & Amortization:
Change in Accounts Receiveable:
Net Cash from Operations:
Repurchases/Buybacks Common Stock:
Issuance of Long-term Debt:
Cash Dividends Paid:
Net Cash from Financing Activities:
Property, Plant & Equipment Purchases:
Purchases of Businesses, Net of Cash:
Net Cash from Investing Activities:
Net Change in Cash & Equivalents:
SLAB Balance Sheet
Enable JavaScript and reload
Cash and Cash Equivalents:
Short-Term Investments:
Accounts Receivable, Net:
Inventories:
Total Current Assets:
Property, Plant & Equipment, Net:
Total Assets:
Accounts Payable:
Current Portion of Long-Term Debt:
Total Short-Term Liabilities:
Long Term Debt, Non-Current Portion:
Total Long-Term Liabilities:
Total Liabilities:
COMPANY PROFILE
2. Significant Accounting Policies Basis of Presentation and Principles of Consolidation The Company prepares financial statements on a 52- or 53-week fiscal year that ends on the Saturday closest to December 31. Fiscal 2021 had 52 weeks. Fiscal 2020 had 53 weeks with the extra week occurring in the first quarter of the year. Fiscal 2019 had 52 weeks. Fiscal 2021, 2020 and 2019 ended on January 1, 2022, January 2, 2021 and December 28, 2019, respectively. The accompanying Consolidated Financial Statements include the accounts of the Company and its wholly owned subsidiaries. All significant intercompany balances and transactions have been eliminated in consolidation. Foreign Currency Transactions The Company’s foreign subsidiaries are considered to be extensions of the U.S. Company. The functional currency of the foreign subsidiaries is the U.S. dollar. Accordingly, gains and losses resulting from remeasuring transactions denominated in currencies other than U.S. dollars are included in interest income and other, net in the Consolidated Statements of Income. Use of Estimates The preparation of financial statements in conformity with U.S. generally accepted accounting principles (GAAP) requires management to make estimates and assumptions that affect the amounts reported in the financial statements and accompanying notes. Among the significant estimates affecting the financial statements are those related to inventories, goodwill, acquired intangible assets, other long-lived assets, revenue recognition, stock-based compensation and income taxes. Actual results could differ from those estimates, and such differences could be material to the financial statements. Fair Value of Financial Instruments The fair values of the Company’s financial instruments are recorded using a hierarchical disclosure framework based upon the level of subjectivity of the inputs used in measuring assets and liabilities. The three levels are described below: Level 1 - Inputs are unadjusted, quoted prices in active markets for identical assets or liabilities at the measurement date. Level 2 - Inputs other than Level 1 that are directly or indirectly observable, such as quoted prices for similar assets or liabilities and quoted prices in less active markets. Level 3 - Inputs are unobservable for the asset or liability and are developed based on the best information available in the circumstances, which might include the Company’s own data. 2. Significant Accounting Policies (Continued) Cash and Cash Equivalents Cash and cash equivalents consist of cash deposits, certificates of deposit, money market funds and investments in debt securities with original maturities of ninety days or less when purchased. Investments The Company’s investments typically have original maturities greater than ninety days as of the date of purchase and are classified as either available-for-sale or trading securities. Investments in available-for-sale securities are reported at fair value, with unrealized gains and losses, net of tax, recorded as a component of accumulated other comprehensive income (loss) in the Consolidated Balance Sheet. Investments in trading securities are reported at fair value, with both realized and unrealized gains and losses recorded in interest income and other, net in the Consolidated Statement of Income. Investments in which the Company has the ability and intent, if necessary, to liquidate in order to support its current operations (including those with contractual maturities greater than one year from the date of purchase) are classified as short-term. The Company reviews its available-for-sale investments as of the end of each reporting period for declines in fair value based on the specific identification method. The Company records an allowance for credit loss when a decline in fair value is due to credit-related factors. The Company considers various factors in determining whether an investment is impaired, including the severity of the impair
Free historical financial statements for Silicon Laboratories Inc. See how revenue, income, cash flow, and balance sheet financials have changed over 61 quarters since 2011. Compare with SLAB stock chart to see long term trends.
Data imported from Silicon Laboratories Inc SEC filings. Check original filings before making any investment decision.