Industrials › Natural Gas Distribution

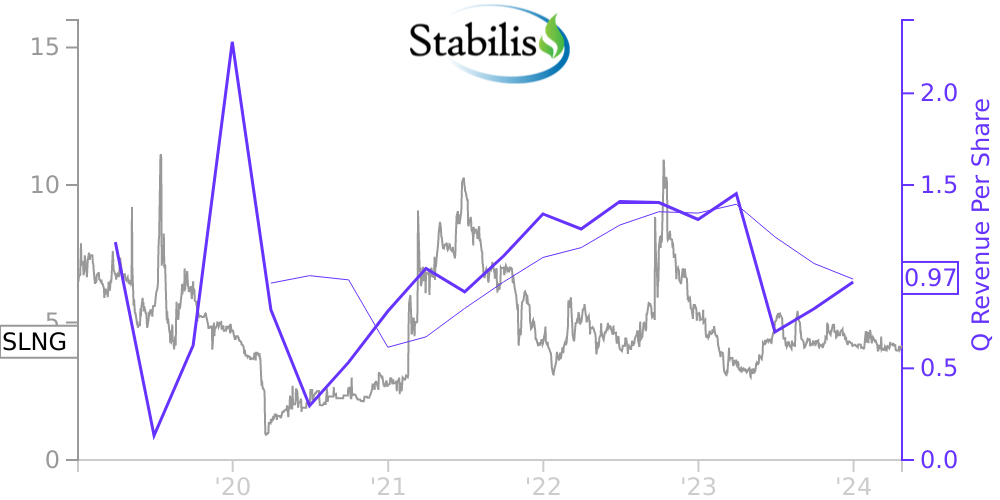
SLNG Stock Price Correlated With Stabilis Solutions Financials
External Links ⌄
Income Statement
Cash Flow
Balance Sheet
SLNG Income Statement
Enable JavaScript and reload
Revenue, Net:
Cost of Goods & Services Sold:
Gross Profit:
Selling, General & Admin Expense:
Research & Development Expense:
Total Operating Expenses:
Operating Income:
Income Taxes:
Net Income:
SLNG Cash Flow
Enable JavaScript and reload
Operating Activities Net Income:
Depreciation, Depletion & Amortization:
Change in Accounts Receiveable:
Net Cash from Operations:
Repurchases/Buybacks Common Stock:
Issuance of Long-term Debt:
Cash Dividends Paid:
Net Cash from Financing Activities:
Property, Plant & Equipment Purchases:
Purchases of Businesses, Net of Cash:
Net Cash from Investing Activities:
Net Change in Cash & Equivalents:
SLNG Balance Sheet
Enable JavaScript and reload
Cash and Cash Equivalents:
Short-Term Investments:
Accounts Receivable, Net:
Inventories:
Total Current Assets:
Property, Plant & Equipment, Net:
Total Assets:
Accounts Payable:
Current Portion of Long-Term Debt:
Total Short-Term Liabilities:
Long Term Debt, Non-Current Portion:
Total Long-Term Liabilities:
Total Liabilities:
COMPANY PROFILE
1. Overview and Basis of Presentation
American Electric Technologies, Inc. and its subsidiaries (the “Company”, “AETI”, “our”, “us” or “we”) currently consists of American Electric Technologies, Inc., which owns 100% of M&I Electric Industries, Inc., including its wholly-owned subsidiary, South Coast Electric Systems, LLC (“SCES”) and M&I Electric Brazil Sistemas e Servicios em Energia LTDA (“M&I Brazil”). Our operations are currently conducted through our Brazilian subsidiary, our interest in a Chinese joint venture and our corporate offices in Bellaire, Texas.
The accompanying unaudited condensed consolidated financial statements of AETI have been prepared in accordance with accounting principles generally accepted in the United States of America (“U.S. GAAP”) for interim financial information and include all adjustments which, in the opinion of management, are necessary for fair financial statement presentation. All adjustments are of a normal recurring nature. In the opinion of management, all adjustments, consisting only of normal recurring adjustments, necessary to fairly state the financial position, results of operations and cash flows with respect to the interim condensed consolidated financial statements have been included. The results of operations for the interim periods are not necessarily indicative of the results for the entire fiscal year. We believe that these financial statements contain all adjustments necessary so that they are not misleading. These unaudited condensed financial statements should be read in conjunction with the Company’s consolidated financial statements included in our Annual Report on Form 10-K for the year ended December 31, 2018, which was filed on April 16, 2019.
Free historical financial statements for Stabilis Solutions Inc.. See how revenue, income, cash flow, and balance sheet financials have changed over 29 quarters since 2019. Compare with SLNG stock chart to see long term trends.
Data imported from Stabilis Solutions Inc. SEC filings. Check original filings before making any investment decision.