Energy › Crude Petroleum And Natural Gas

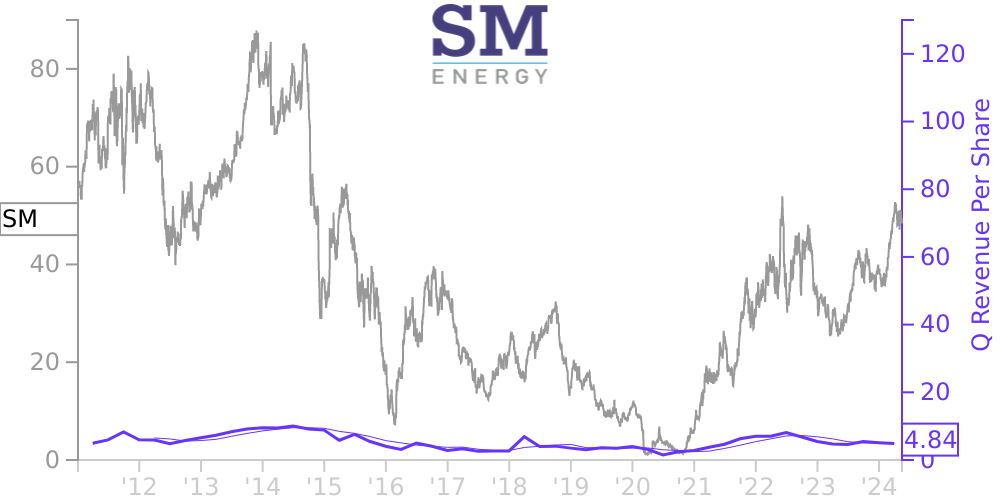
SM Stock Price Correlated With SM Energy Co Financials
External Links ⌄
Income Statement
Cash Flow
Balance Sheet
SM Income Statement
Enable JavaScript and reload
Revenue, Net:
Cost of Goods & Services Sold:
Gross Profit:
Selling, General & Admin Expense:
Research & Development Expense:
Total Operating Expenses:
Operating Income:
Income Taxes:
Net Income:
SM Cash Flow
Enable JavaScript and reload
Operating Activities Net Income:
Depreciation, Depletion & Amortization:
Change in Accounts Receiveable:
Net Cash from Operations:
Repurchases/Buybacks Common Stock:
Issuance of Long-term Debt:
Cash Dividends Paid:
Net Cash from Financing Activities:
Property, Plant & Equipment Purchases:
Purchases of Businesses, Net of Cash:
Net Cash from Investing Activities:
Net Change in Cash & Equivalents:
SM Balance Sheet
Enable JavaScript and reload
Cash and Cash Equivalents:
Short-Term Investments:
Accounts Receivable, Net:
Inventories:
Total Current Assets:
Property, Plant & Equipment, Net:
Total Assets:
Accounts Payable:
Current Portion of Long-Term Debt:
Total Short-Term Liabilities:
Long Term Debt, Non-Current Portion:
Total Long-Term Liabilities:
Total Liabilities:
COMPANY PROFILE
Note 1 – Summary of Significant Accounting Policies
Description of Operations
SM Energy Company, together with its consolidated subsidiaries, is an independent energy company engaged in the acquisition, exploration, development, and production of oil, gas, and NGLs in the state of Texas.
Basis of Presentation
The accompanying consolidated financial statements include the accounts of the Company and have been prepared in accordance with GAAP and the instructions to Form 10-K and Regulation S-X. Intercompany accounts and transactions have been eliminated. In connection with the preparation of the accompanying consolidated financial statements, the Company evaluated events subsequent to the balance sheet date of December 31, 2021, through the filing of this report. Additionally, certain prior period amounts have been reclassified to conform to current period presentation in the accompanying consolidated financial statements.
Use of Estimates in the Preparation of Financial Statements
The preparation of financial statements in conformity with GAAP requires management to make estimates and assumptions that affect the reported amounts of proved oil and gas reserves, assets and liabilities, disclosure of contingent assets and liabilities at the date of the financial statements, and the reported amounts of revenues and expenses during the reporting period. Actual results could differ from those estimates. Estimates of proved oil and gas reserve quantities provide the basis for the calculation of DD&A expense, impairment of proved and unproved oil and gas properties, and asset retirement obligations, each of which represents a significant component of the accompanying consolidated financial statements.
Cash and Cash Equivalents
The Company considers all liquid investments purchased with an initial maturity of three months or less to be cash equivalents. The carrying value of cash and cash equivalents approximates fair value due to the short-term nature of these instruments.
Accounts Receivable
The Company’s accounts receivable primarily consist of receivables due from oil, gas, and NGL purchasers and from joint interest owners on properties the Company operates. For receivables due from joint interest owners, the Company generally has the ability to withhold future revenue disbursements to recover non-payment of joint interest billings. Generally, the Company’s oil, gas, and NGL receivables are collected within 30 to 90 days and the Company has had minimal bad debts. Although diversified among many companies, collectability is dependent upon the financial wherewithal of each individual company and is influenced by the general economic conditions of the industry. Receivables are not collateralized. Please refer to Note 13 – Accounts Receivable and Accounts Payable and Accrued Expenses for additional disclosure.
Concentration of Credit Risk and Major Customers
The Company is exposed to credit risk in the event of nonpayment by counterparties, a significant portion of which are concentrated in energy related industries. The creditworthiness of customers and other counterparties is subject to regular review.
The Company does not believe the loss of any single purchaser of its production would materially impact its operating results, as oil, gas, and NGLs are products with well-established markets and numerous purchasers in the Company’s operating areas. The following major customers and entities under common control accounted for 10 percent or more of the Company’s total oil, gas, and NGL production revenue for at least one of the periods presented:
For the Years Ended December 31, 2021 2020 2019 Major customer #1 27 % 15 % 4 % Major customer #2 18 % 6 % 9 % Major customer #3 15 % 24 % 13 % Major customer #4 9 % 20 % 14 % Major customer #5 1 % — % 18 % Group #1 of entities under common control (1)
7 % 5 % 13 % Group #2 of entities under common control (1)
6 % 7 % 11 %
__________________________________________
Free historical financial statements for SM Energy Co.. See how revenue, income, cash flow, and balance sheet financials have changed over 61 quarters since 2011. Compare with SM stock chart to see long term trends.
Data imported from SM Energy Co. SEC filings. Check original filings before making any investment decision.