
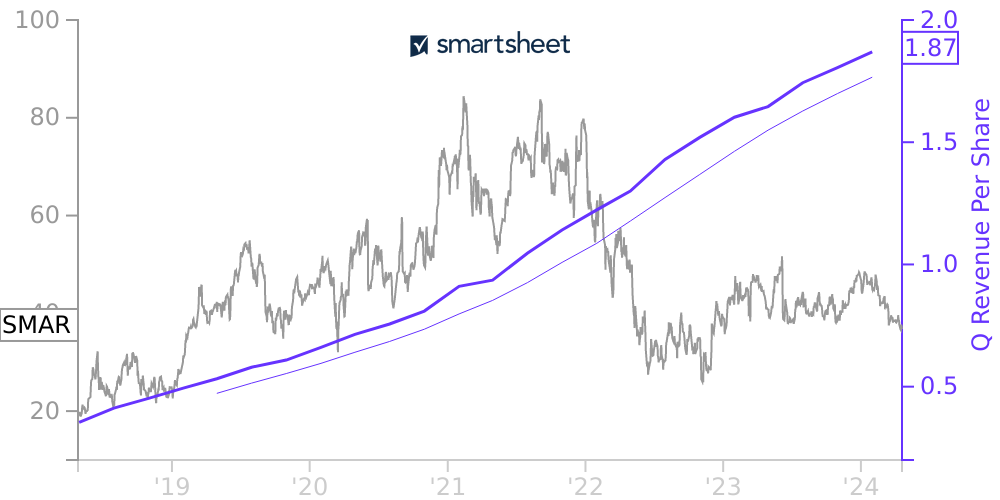
SMAR Stock Price Correlated With Smartsheet Financials
External Links ⌄
Income Statement
Cash Flow
Balance Sheet
SMAR Income Statement
Enable JavaScript and reload
Revenue, Net:
Cost of Goods & Services Sold:
Gross Profit:
Selling, General & Admin Expense:
Research & Development Expense:
Total Operating Expenses:
Operating Income:
Income Taxes:
Net Income:
SMAR Cash Flow
Enable JavaScript and reload
Operating Activities Net Income:
Depreciation, Depletion & Amortization:
Change in Accounts Receiveable:
Net Cash from Operations:
Repurchases/Buybacks Common Stock:
Issuance of Long-term Debt:
Cash Dividends Paid:
Net Cash from Financing Activities:
Property, Plant & Equipment Purchases:
Purchases of Businesses, Net of Cash:
Net Cash from Investing Activities:
Net Change in Cash & Equivalents:
SMAR Balance Sheet
Enable JavaScript and reload
Cash and Cash Equivalents:
Short-Term Investments:
Accounts Receivable, Net:
Inventories:
Total Current Assets:
Property, Plant & Equipment, Net:
Total Assets:
Accounts Payable:
Current Portion of Long-Term Debt:
Total Short-Term Liabilities:
Long Term Debt, Non-Current Portion:
Total Long-Term Liabilities:
Total Liabilities:
COMPANY PROFILE
Overview and Basis of Presentation Description of business
Smartsheet Inc. (the “Company,” “we,” “our”) was incorporated in the State of Washington in 2005, and is headquartered in Bellevue, Washington. The Company is a leading enterprise platform for dynamic work, enabling teams and organizations of all sizes to plan, capture, manage, automate, and report on work at scale, resulting in more efficient processes and better business outcomes. Customers access their accounts online via a web-based interface or a mobile application. Some customers also purchase the Company’s professional services, which primarily consist of consulting and training services.
Collapse of dual class common stock structure
On September 19, 2019, all outstanding shares of the Company’s Class B common stock automatically converted into the same number of shares of the Company's Class A common stock, pursuant to the terms of the Company's amended and restated articles of incorporation (the “Articles”). No additional shares of Class B common stock will be issued following this conversion.
The conversion occurred pursuant to the Articles, which provide that each share of Class B common stock would convert automatically, without further action by the Company, into one share of Class A common stock at the close of business on the date on which the outstanding shares of Class B common stock represented less than 15% of the aggregate number of shares of Class A common stock and Class B common stock then outstanding. In accordance with the Articles, the shares of Class B common stock that converted as a result of the automatic conversion were retired and will not be reissued by the Company.
Follow-on offering
On June 14, 2019, we completed a public equity offering in which we issued and sold 9,025,000 shares of Class A common stock, inclusive of the exercised over-allotment option, at a public offering price of $43.50 per share. In addition, 5,810,000 shares of the Company’s common stock were sold by selling shareholders of the Company, inclusive of the over-allotment, as part of this offering. We received net proceeds of $379.0 million after deducting underwriting discounts and commissions of $12.8 million and other issuance costs of $0.9 million. We did not receive any proceeds from the sale of common stock by selling shareholders.
Basis of presentation
The accompanying consolidated financial statements have been prepared in conformity with accounting principles generally accepted in th e United States of America (“GAAP”), and applicable rules and regulations of the Securities and Exchange Commission (“SEC”) regarding financial reporting. The Company’s fiscal year ends on January 31.
The consolidated financial statements include the results of Smartsheet Inc. and its wholly owned subsidiaries, which are located in the United States, the United Kingdom, Australia, Germany, and Costa Rica. All intercompany balances and transactions have been eliminated upon consolidation.
In the opinion of management, the information contained herein reflects all adjustments necessary for a fair presentation of our consolidated financial statements. All such adjustments are of a normal, recurring nature.
Use of estimates
The preparation of the consolidated financial statements in conformity with GAAP requires management to make estimates, judgments, and assumptions that affect the reported amounts of assets and liabilities, disclosure of contingent assets and liabilities at the date of the consolidated financial statements, and the reported amounts of revenue and expenses during the reporting periods. The Company bases its estimates on historical experience and on other assumptions that its management believes are reasonable under the circumstances. Actual results could differ from those estimates. The Company’s most significant estimates and judgments involve revenue recognition with respect to the allocation of transaction consideration for the Company’s offerings
Free historical financial statements for Smartsheet Inc. See how revenue, income, cash flow, and balance sheet financials have changed over 27 quarters since 2018. Compare with SMAR stock chart to see long term trends.
Data imported from Smartsheet Inc SEC filings. Check original filings before making any investment decision.