Technology › Semiconductors And Related Devices

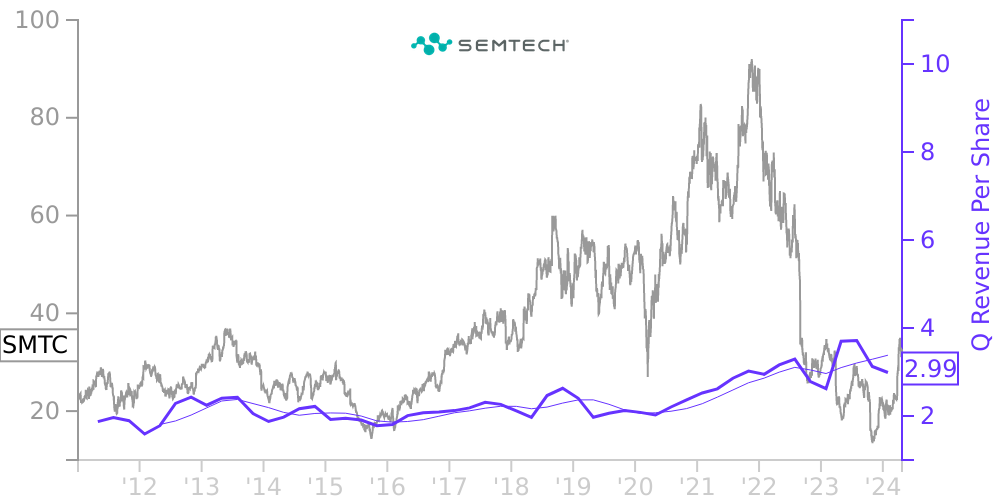
SMTC Stock Price Correlated With Semtech Financials
External Links ⌄
Income Statement
Cash Flow
Balance Sheet
SMTC Income Statement
Enable JavaScript and reload
Revenue, Net:
Cost of Goods & Services Sold:
Gross Profit:
Selling, General & Admin Expense:
Research & Development Expense:
Total Operating Expenses:
Operating Income:
Income Taxes:
Net Income:
SMTC Cash Flow
Enable JavaScript and reload
Operating Activities Net Income:
Depreciation, Depletion & Amortization:
Change in Accounts Receiveable:
Net Cash from Operations:
Repurchases/Buybacks Common Stock:
Issuance of Long-term Debt:
Cash Dividends Paid:
Net Cash from Financing Activities:
Property, Plant & Equipment Purchases:
Purchases of Businesses, Net of Cash:
Net Cash from Investing Activities:
Net Change in Cash & Equivalents:
SMTC Balance Sheet
Enable JavaScript and reload
Cash and Cash Equivalents:
Short-Term Investments:
Accounts Receivable, Net:
Inventories:
Total Current Assets:
Property, Plant & Equipment, Net:
Total Assets:
Accounts Payable:
Current Portion of Long-Term Debt:
Total Short-Term Liabilities:
Long Term Debt, Non-Current Portion:
Total Long-Term Liabilities:
Total Liabilities:
COMPANY PROFILE
Organization and Basis of Presentation Semtech Corporation (together with its consolidated subsidiaries, the "Company" or "Semtech") is a leading global supplier of high-performance analog and mixed-signal semiconductors and advanced algorithms. The end customers for the Company’s products are primarily original equipment manufacturers ("OEMs") that produce and sell electronics.
The Company designs, develops and markets a wide range of products for commercial applications, the majority of which are sold into the infrastructure, high-end consumer and industrial end markets.
Basis of Presentation
The Company reports results on the basis of 52 and 53-week periods and ends its fiscal year on the last Sunday in January. Fiscal years 2022, 2021 and 2020 consisted of 52 weeks, 53 weeks and 52 weeks, respectively.
Principles of Consolidation
The accompanying consolidated financial statements include the accounts of the Company and its majority-owned subsidiaries and have been prepared in accordance with accounting principles generally accepted in the United States (“GAAP”). The Company’s Consolidated Statements of Income are referred to herein as the "Statements of Income," the Company’s Consolidated Balance Sheets are referred to herein as the "Balance Sheets" and the Company's Consolidated Statements of Cash Flows are referred to herein as the "Statements of Cash Flows." In the opinion of the Company, all adjustments of a normal and recurring nature necessary for a fair presentation, in all material respects, of the consolidated financial statements have been made. All intercompany balances have been eliminated. The Company consolidates entities that are not variable interest entities ("VIEs") when it owns, directly or indirectly, a majority interest in the entity or is otherwise able to control the entity. The Company consolidates VIEs in accordance with Financial Accounting Standards Board ("FASB") Accounting Standards Codification ("ASC") 810, "Consolidation." Entities for which the Company owns an interest, but does not consolidate, are accounted for under the equity method or cost method of accounting as minority investments and are included in “Other Assets” within the Balance Sheets. The ownership interest in a consolidated subsidiary of the Company held by outside parties is included in “Noncontrolling Interest” within the Balance Sheets.
Use of Estimates
The preparation of the consolidated financial statements in conformity with GAAP requires management to make estimates and assumptions that affect the reported amounts of assets and liabilities and disclosure of contingent assets and liabilities at the date of the consolidated financial statements and the reported amounts of revenues and expenses during the reporting period. Actual results could differ from those estimates.
Free historical financial statements for Semtech Corp. See how revenue, income, cash flow, and balance sheet financials have changed over 61 quarters since 2011. Compare with SMTC stock chart to see long term trends.
Data imported from Semtech Corp SEC filings. Check original filings before making any investment decision.