Industrials › Metalworking Machinery And Equipment

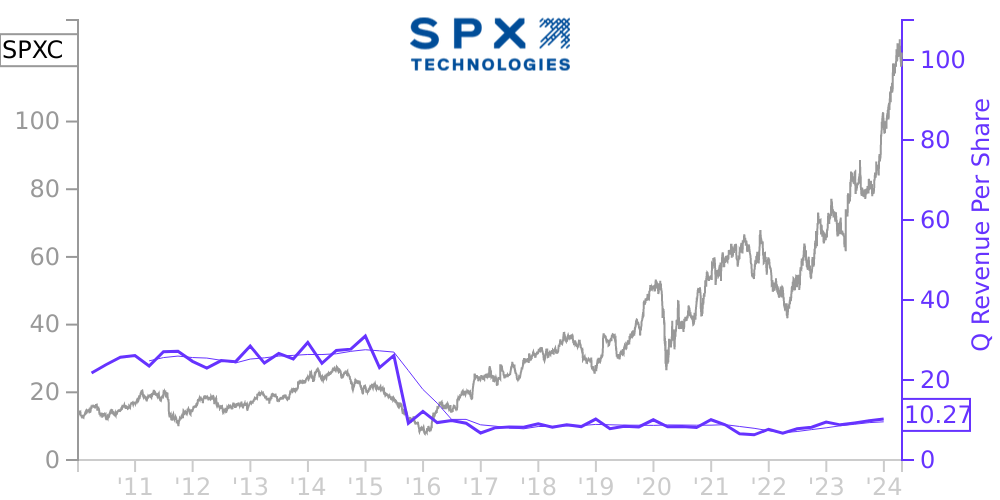
SPXC Stock Price Correlated With SPX Financials
External Links ⌄
Income Statement
Cash Flow
Balance Sheet
SPXC Income Statement
Enable JavaScript and reload
Revenue, Net:
Cost of Goods & Services Sold:
Gross Profit:
Selling, General & Admin Expense:
Research & Development Expense:
Total Operating Expenses:
Operating Income:
Income Taxes:
Net Income:
SPXC Cash Flow
Enable JavaScript and reload
Operating Activities Net Income:
Depreciation, Depletion & Amortization:
Change in Accounts Receiveable:
Net Cash from Operations:
Repurchases/Buybacks Common Stock:
Issuance of Long-term Debt:
Cash Dividends Paid:
Net Cash from Financing Activities:
Property, Plant & Equipment Purchases:
Purchases of Businesses, Net of Cash:
Net Cash from Investing Activities:
Net Change in Cash & Equivalents:
SPXC Balance Sheet
Enable JavaScript and reload
Cash and Cash Equivalents:
Short-Term Investments:
Accounts Receivable, Net:
Inventories:
Total Current Assets:
Property, Plant & Equipment, Net:
Total Assets:
Accounts Payable:
Current Portion of Long-Term Debt:
Total Short-Term Liabilities:
Long Term Debt, Non-Current Portion:
Total Long-Term Liabilities:
Total Liabilities:
COMPANY PROFILE
(1) BASIS OF PRESENTATION
We prepared the condensed consolidated financial statements pursuant to the rules and regulations of the Securities and Exchange Commission (SEC) for interim reporting. As permitted under those rules and regulations, certain footnotes or other financial information that are normally required by accounting principles generally accepted in the United States (GAAP) can be condensed or omitted. In our opinion, the financial statements include the adjustments (consisting only of normal and recurring items) necessary for their fair presentation and represent our accounts after the elimination of intercompany transactions.
Investments in unconsolidated companies where we exercise significant influence but do not have control are accounted for using the equity method. In determining whether we are the primary beneficiary of a variable interest entity (VIE), we perform a qualitative analysis that considers the design of the VIE, the nature of our involvement and the variable interests held by other parties to determine which party has the power to direct the activities of the VIE that most significantly impact the entitys economic performance, and the obligation to absorb losses or the right to receive benefits of the entity that could potentially be significant to the VIE. We do have interests in VIEs, primarily joint ventures, in which we are the primary beneficiary and others in which we are not. All of our VIEs are considered immaterial, individually or in aggregate, to our consolidated balance sheets, statements of operations and statements of cash flows.
Our only significant investment reported under the equity method is our 44.5% interest in the EGS Electrical Group, LLC and Subsidiaries (EGS) joint venture, which we account for on a three-month lag. EGSs revenues and our equity earnings from our investment in EGS totaled $111.9 and $8.3 and $133.9 and $10.5 for the three months ended April 3, 2010 and March 28, 2009, respectively.
Preparing financial statements requires us to make estimates and assumptions that affect the reported amounts of assets, liabilities, revenues and expenses. Actual results could differ from these estimates. The unaudited information included in this Quarterly Report on Form 10-Q should be read in conjunction with the consolidated financial statements contained in our 2009 Annual Report on Form 10-K. Interim results are not necessarily indicative of expected results for a full year. We have reclassified prior year amounts related to discontinued operations to conform to the current year presentation. Unless otherwise indicated, amounts provided in these Notes pertain to continuing operations (see Note 3 for information on discontinued operations).
We establish actual interim closing dates using a fiscal calendar, which requires our businesses to close their books on the Saturday closest to the end of the calendar quarter for the first quarter, with the second and third quarters being 91 days in length. Our fourth quarter ends on December 31. The interim closing dates for the first, second and third quarters of 2010 are April 3, July 3 and October 2, compared to March 28, June 27 and September 26 for 2009, respectively. This practice only impacts the quarterly reporting periods and not the annual reporting period. We had six additional days in the first quarter of 2010 and will have six fewer days in the fourth quarter of 2010 when compared to the respective 2009 periods.
Free historical financial statements for SPX Corp.. See how revenue, income, cash flow, and balance sheet financials have changed over 65 quarters since 2010. Compare with SPXC stock chart to see long term trends.
Data imported from SPX Corp. SEC filings. Check original filings before making any investment decision.