
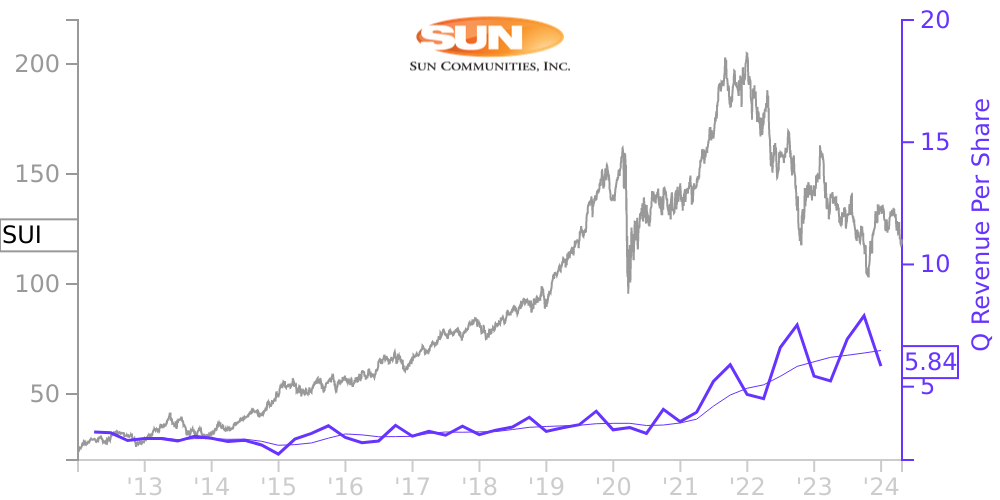
SUI Stock Price Correlated With Sun Communities Financials
External Links ⌄
Income Statement
Cash Flow
Balance Sheet
SUI Income Statement
Enable JavaScript and reload
Revenue, Net:
Cost of Goods & Services Sold:
Gross Profit:
Selling, General & Admin Expense:
Research & Development Expense:
Total Operating Expenses:
Operating Income:
Income Taxes:
Net Income:
SUI Cash Flow
Enable JavaScript and reload
Operating Activities Net Income:
Depreciation, Depletion & Amortization:
Change in Accounts Receiveable:
Net Cash from Operations:
Repurchases/Buybacks Common Stock:
Issuance of Long-term Debt:
Cash Dividends Paid:
Net Cash from Financing Activities:
Property, Plant & Equipment Purchases:
Purchases of Businesses, Net of Cash:
Net Cash from Investing Activities:
Net Change in Cash & Equivalents:
SUI Balance Sheet
Enable JavaScript and reload
Cash and Cash Equivalents:
Short-Term Investments:
Accounts Receivable, Net:
Inventories:
Total Current Assets:
Property, Plant & Equipment, Net:
Total Assets:
Accounts Payable:
Current Portion of Long-Term Debt:
Total Short-Term Liabilities:
Long Term Debt, Non-Current Portion:
Total Long-Term Liabilities:
Total Liabilities:
COMPANY PROFILE
Sun Communities, Inc., a Maryland corporation, and all wholly-owned or majority-owned and controlled subsidiaries, including Sun Communities Operating Limited Partnership (the "Operating Partnership"), Sun Home Services, Inc. ("SHS"), Safe Harbor Marinas, LLC ("Safe Harbor") and Tiger Topco 1 Limited (together with its subsidiaries, "Park Holidays") are referred to herein as the "Company," "SUI," "us," "we," and "our."
We follow accounting standards set by the Financial Accounting Standards Board ("FASB"). FASB establishes accounting principles generally accepted in the United States of America ("GAAP"), which we follow to ensure that we consistently report our financial condition, results of operations and cash flows. References to GAAP issued by the FASB in these footnotes are to the FASB Accounting Standards Codification ("ASC"). These unaudited Consolidated Financial Statements have been prepared pursuant to the rules and regulations of the Securities and Exchange Commission ("SEC") for interim financial information and in accordance with GAAP. We present interim disclosures and certain information and footnote disclosures as required by SEC rules and regulations. Accordingly, the unaudited Consolidated Financial Statements do not include all of the information and footnotes required by GAAP for complete financial statements. The accompanying unaudited Consolidated Financial Statements reflect, in the opinion of management, all adjustments, including adjustments of a normal and recurring nature, necessary for a fair presentation of the interim financial statements. All intercompany transactions have been eliminated in consolidation.
Certain prior period amounts have been revised to conform with current presentation, with no effect on net income. These include reclassification of certain revenues and expenses between Real property and Service, retail, dining and entertainment within our Marina Portfolio. There was no impact to prior period net income, shareholders equity or cash flows for any of the reclassifications. Further, the reclassification had no impact on previously reported total marina Net Operating Income ("NOI").
The results of operations for interim periods are not necessarily indicative of results that may be expected for any other interim period or for the full year. These unaudited Consolidated Financial Statements should be read in conjunction with the Consolidated Financial Statements and notes thereto included in our Annual Report on Form 10-K for the year ended December 31, 2021 as filed with the SEC on February 22, 2022 (our "2021 Annual Report"). These statements have been prepared on a basis that is substantially consistent with the accounting principles applied in our 2021 Annual Report.
Our three reportable segments are: (i) Manufactured home ("MH") communities, (ii) Recreational vehicle ("RV") resorts and (iii) Marina.
Free historical financial statements for Sun Communities Inc.. See how revenue, income, cash flow, and balance sheet financials have changed over 57 quarters since 2012. Compare with SUI stock chart to see long term trends.
Data imported from Sun Communities Inc. SEC filings. Check original filings before making any investment decision.