Technology › Semiconductors And Related Devices

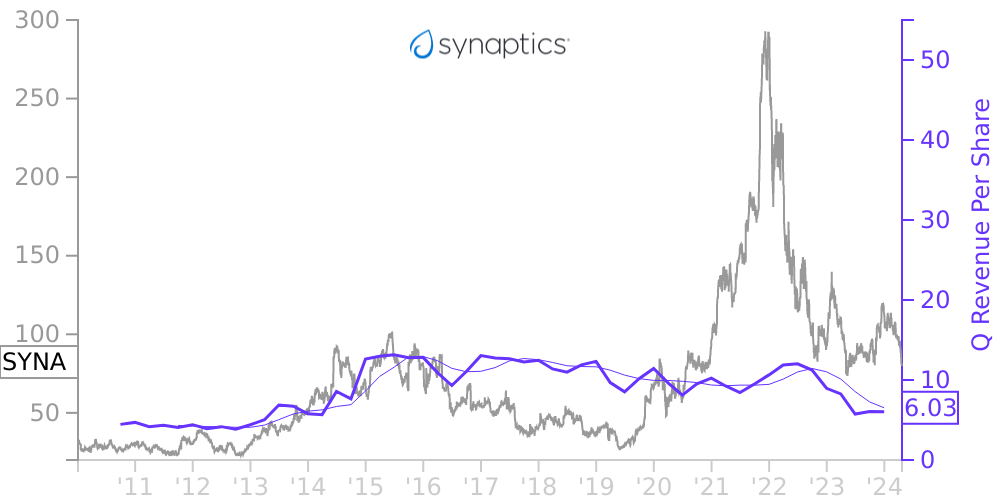
SYNA Stock Price Correlated With Synaptics Financials
External Links ⌄
Income Statement
Cash Flow
Balance Sheet
SYNA Income Statement
Enable JavaScript and reload
Revenue, Net:
Cost of Goods & Services Sold:
Gross Profit:
Selling, General & Admin Expense:
Research & Development Expense:
Total Operating Expenses:
Operating Income:
Income Taxes:
Net Income:
SYNA Cash Flow
Enable JavaScript and reload
Operating Activities Net Income:
Depreciation, Depletion & Amortization:
Change in Accounts Receiveable:
Net Cash from Operations:
Repurchases/Buybacks Common Stock:
Issuance of Long-term Debt:
Cash Dividends Paid:
Net Cash from Financing Activities:
Property, Plant & Equipment Purchases:
Purchases of Businesses, Net of Cash:
Net Cash from Investing Activities:
Net Change in Cash & Equivalents:
SYNA Balance Sheet
Enable JavaScript and reload
Cash and Cash Equivalents:
Short-Term Investments:
Accounts Receivable, Net:
Inventories:
Total Current Assets:
Property, Plant & Equipment, Net:
Total Assets:
Accounts Payable:
Current Portion of Long-Term Debt:
Total Short-Term Liabilities:
Long Term Debt, Non-Current Portion:
Total Long-Term Liabilities:
Total Liabilities:
COMPANY PROFILE
1.
Organization and Summary of Significant Accounting Policies
Organization and Basis of Presentation
We are a leading worldwide developer and supplier of custom-designed semiconductor solutions that is changing the way humans engage with connected devices and data, engineering exceptional experiences throughout the home, at work, in the car and on the go. We currently generate revenue from the markets for Internet of Things, or IoT, products, which include smart devices with voice, speech, video, wireless connectivity, smartphones, augmented reality and virtual reality devices, tablets, personal computer, or PC, products, and other select electronic devices, including devices in automobiles. We deliver semiconductor solutions including connectivity products, audio input and output System-On-Chips, or SoCs, high-definition video and vision SoCs, touch controllers, display drivers, fingerprint sensors, and touchpads, which comprise our semiconductor chip, firmware, and software as a complete customer solution.
The consolidated financial statements are presented in accordance with U.S. generally accepted accounting principles, or U.S. GAAP, and include our financial statements and those of our wholly owned subsidiaries. All significant intercompany balances and transactions have been eliminated upon consolidation.
Our fiscal year is the 52- or 53-week period ending on the last Saturday in June. The fiscal years presented in this report were 52-week periods ended June 26, 2021, June 27, 2020 and June 29, 2019.
Use of Estimates
The preparation of consolidated financial statements in conformity with U.S. GAAP requires us to make estimates and judgments that affect the reported amounts of assets, liabilities, revenue, expenses, and related disclosure of contingent assets and liabilities. On an ongoing basis, we evaluate our estimates, including those related to revenue, allowance for doubtful accounts, cost of revenue, inventories, loss on purchase commitments, product warranty, accrued liabilities, share-based compensation costs, provision for income taxes, deferred income tax asset valuation allowances, uncertain tax positions, goodwill, intangible assets, investments, and loss contingencies. We base our estimates on historical experience, applicable laws and regulations, and various other assumptions that we believe to be reasonable under the circumstances, including our expectations regarding the potential impacts on our business of the COVID-19 pandemic, the results of which form the basis for making judgments about the carrying value of assets and liabilities that are not readily apparent from other sources. Actual results may differ from these estimates under different assumptions or conditions.
Cash Equivalents and Investments
Cash equivalents consist of highly liquid investments with original maturities of three months or less.
Our cash equivalents as of the end of fiscal 2021 are bank deposits and as of the end of fiscal 2020 were money market accounts with a fair value of $509.1 million and $521.1 million, respectively.
Fair Value
We measure certain financial assets and liabilities at fair value. When we measure fair value on either a recurring or nonrecurring basis, inputs used in valuation techniques are assigned a hierarchical level as follows:
•
Level 1 inputs are observable inputs that reflect quoted prices for identical assets or liabilities in active markets.
•
Level 2 inputs reflect quoted prices for identical assets or liabilities in markets that are not active; quoted prices for similar assets or liabilities in active markets; inputs other than quoted prices that are observable for the assets or liabilities; or inputs that are derived principally from or corroborated by observable market data by correlation or other means.
•
Level 3 inputs are unobservable inputs reflecting our assumptions, which are incorporated into valuation techniques and models used to determine fair value. The assumptions
Free historical financial statements for Synaptics Inc. See how revenue, income, cash flow, and balance sheet financials have changed over 63 quarters since 2010. Compare with SYNA stock chart to see long term trends.
Data imported from Synaptics Inc SEC filings. Check original filings before making any investment decision.