Communication › Telephone Communications (No Radio Telephone)

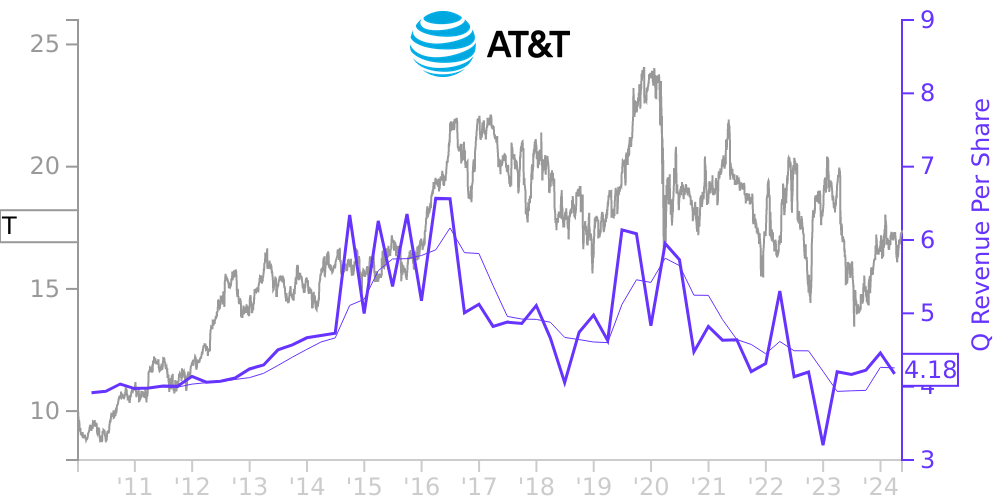
T Stock Price Correlated With AT&T Financials
External Links ⌄
Income Statement
Cash Flow
Balance Sheet
T Income Statement
Enable JavaScript and reload
Revenue, Net:
Cost of Goods & Services Sold:
Gross Profit:
Selling, General & Admin Expense:
Research & Development Expense:
Total Operating Expenses:
Operating Income:
Income Taxes:
Net Income:
T Cash Flow
Enable JavaScript and reload
Operating Activities Net Income:
Depreciation, Depletion & Amortization:
Change in Accounts Receiveable:
Net Cash from Operations:
Repurchases/Buybacks Common Stock:
Issuance of Long-term Debt:
Cash Dividends Paid:
Net Cash from Financing Activities:
Property, Plant & Equipment Purchases:
Purchases of Businesses, Net of Cash:
Net Cash from Investing Activities:
Net Change in Cash & Equivalents:
T Balance Sheet
Enable JavaScript and reload
Cash and Cash Equivalents:
Short-Term Investments:
Accounts Receivable, Net:
Inventories:
Total Current Assets:
Property, Plant & Equipment, Net:
Total Assets:
Accounts Payable:
Current Portion of Long-Term Debt:
Total Short-Term Liabilities:
Long Term Debt, Non-Current Portion:
Total Long-Term Liabilities:
Total Liabilities:
COMPANY PROFILE
NOTE 1 . PREPARATION OF INTERIM FINANCIAL STATEMENTS Basis of Presentation Throughout this document, AT&T Inc. is referred to as “AT&T,” “we” or the “Company.” We believe that these consolidated financial stat ements include all adjustments, consisting on ly of normal recurring accruals, that are necessary to present fairly the results for the presented interim periods. The results for the interim periods are not necessarily indicative of those for the full year. You should read this document in conjunction with the consolidated financial statements and accompanying notes included in our Annual Report on Form 10-K for the year ended December 31, 20 12 . The consolidated financial statements include the accounts of the Company and our majority-owned subsidiaries and affiliates. Our subsidiaries and affiliates operate in the communications services industry both domestically and internationally, provid ing wireless communications services , traditional voice services , data/broadband and internet services, video services, telecommunications equipment, managed networking and wholesale ser vices . All significant intercompany transactions are eliminated in the consolidation process. Investments in partnerships and less than majority-owned subsidiaries where we have significant influence are accounted for under the equity method. Earnings from certain foreign equity investments accounted for using the equity method are included for periods ended within up to one month of our period end. We also record our proportionate share of our equity method investees' other comprehensive income (OCI) items, including actuarial gains and losses on pension and other postretirement benefit obligations. The preparation of financial statements in conformity with U.S. generally accepted accounting principles (GAAP) requires management to make estimates and assumptions that affect the amounts reported in the financial statements and accompanying notes, including estimates of probable losses and expenses. Actual results could differ from those estimates. Certain amounts have been reclassified to conform to the current per iod's presentation . Stock Repurchase Program During the first quarter of 2013, we repurchased 168 million shares for $5,911 under a repurchase authorization that was approved by our Board of Directors in July 2012 . At March 31, 2013, we had 61 mill ion shares remaining under that authoriza tion. In March 2013, our Board of Directors authorized the repurchase of up to an additional 300 million shares of our common stock. The plan has no expiration date.
Free historical financial statements for AT&T Inc. See how revenue, income, cash flow, and balance sheet financials have changed over 66 quarters since 2010. Compare with T stock chart to see long term trends.
Data imported from AT&T Inc SEC filings. Check original filings before making any investment decision.