Industrials › Services-Help Supply Services

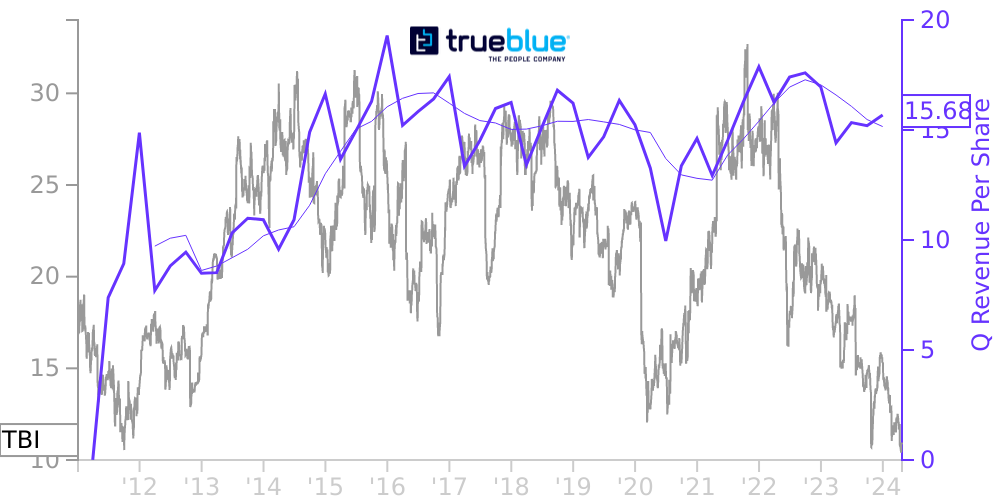
TBI Stock Price Correlated With TrueBlue Financials
External Links ⌄
Income Statement
Cash Flow
Balance Sheet
TBI Income Statement
Enable JavaScript and reload
Revenue, Net:
Cost of Goods & Services Sold:
Gross Profit:
Selling, General & Admin Expense:
Research & Development Expense:
Total Operating Expenses:
Operating Income:
Income Taxes:
Net Income:
TBI Cash Flow
Enable JavaScript and reload
Operating Activities Net Income:
Depreciation, Depletion & Amortization:
Change in Accounts Receiveable:
Net Cash from Operations:
Repurchases/Buybacks Common Stock:
Issuance of Long-term Debt:
Cash Dividends Paid:
Net Cash from Financing Activities:
Property, Plant & Equipment Purchases:
Purchases of Businesses, Net of Cash:
Net Cash from Investing Activities:
Net Change in Cash & Equivalents:
TBI Balance Sheet
Enable JavaScript and reload
Cash and Cash Equivalents:
Short-Term Investments:
Accounts Receivable, Net:
Inventories:
Total Current Assets:
Property, Plant & Equipment, Net:
Total Assets:
Accounts Payable:
Current Portion of Long-Term Debt:
Total Short-Term Liabilities:
Long Term Debt, Non-Current Portion:
Total Long-Term Liabilities:
Total Liabilities:
COMPANY PROFILE
ACCOUNTING PRINCIPLES AND PRACTICES
Financial Statement Preparation
The accompanying unaudited Consolidated Financial Statements (“financial statements”) of TrueBlue, Inc. (the "Company", "we", "us", "our", and "TrueBlue") are prepared in accordance with U.S. generally accepted accounting principles ("GAAP") for interim financial information and rules and regulations of the Securities and Exchange Commission. Accordingly, certain information and footnote disclosures usually found in financial statements prepared in accordance with GAAP have been condensed or omitted. The financial statements reflect all adjustments which, in the opinion of management, are necessary to fairly state the financial statements for the interim periods presented. We follow the same accounting policies for preparing both quarterly and annual financial statements.
These financial statements should be read in conjunction with the audited consolidated financial statements and related notes included in our Annual Report on Form 10-K for the fiscal year ended December 28, 2012 . The results of operations for the thirteen and thirty-nine weeks ended September 27, 2013 are not necessarily indicative of the results expected for the full fiscal year or for any other fiscal period.
Cash and Cash Equivalents and Marketable Securities
We consider all highly liquid instruments purchased with an original maturity of three months or less at date of purchase to be cash equivalents. Investments with original maturities greater than three months are classified as marketable securities. Our marketable securities consist of variable-rate demand notes and certificate of deposits. All of our marketable securities are classified as available-for-sale and are reported at fair value, with any unrealized gains and losses, net of tax, recorded in Other comprehensive income (loss). We manage our cash equivalents and marketable securities as a single portfolio of highly liquid securities.
Recently Issued Accounting Pronouncements not yet Adopted
In July 2013, the FASB issued authoritative guidance for the presentation of an unrecognized tax benefit when a net operating loss carryforward, a similar tax loss, or a tax credit carryforward exists. The guidance requires that an unrecognized tax benefit, or a portion of an unrecognized tax benefit, be presented in the financial statements as a reduction to a deferred tax asset for a net operating loss carryforward, a similar tax loss, or a tax credit carryforward, except to the extent when, for certain reasons, it is not available. The guidance will be effective for our first quarter of fiscal 2014. Management does not expect the adoption of this guidance to have a material impact on our financial statements.
Free historical financial statements for TrueBlue Inc.. See how revenue, income, cash flow, and balance sheet financials have changed over 61 quarters since 2011. Compare with TBI stock chart to see long term trends.
Data imported from TrueBlue Inc. SEC filings. Check original filings before making any investment decision.