Energy › Water Transportation

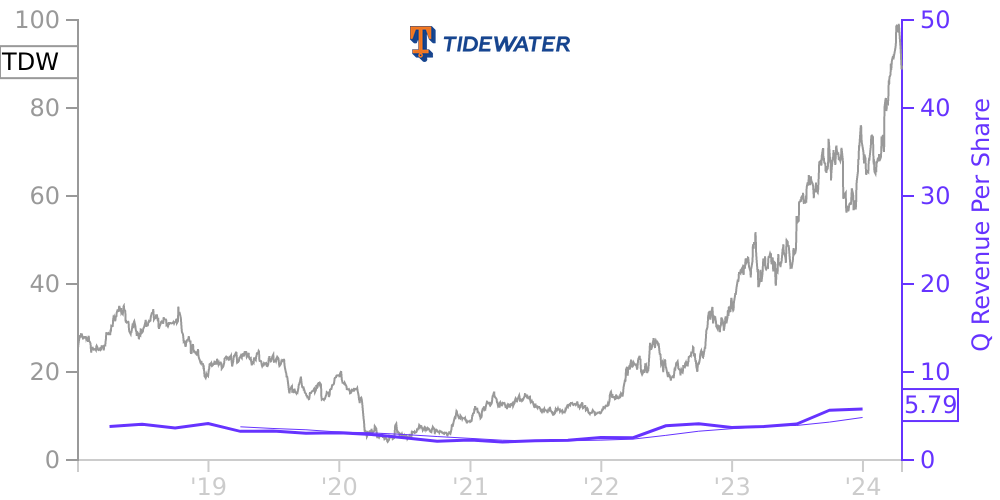
TDW Stock Price Correlated With Tidewater Financials
External Links ⌄
Income Statement
Cash Flow
Balance Sheet
TDW Income Statement
Enable JavaScript and reload
Revenue, Net:
Cost of Goods & Services Sold:
Gross Profit:
Selling, General & Admin Expense:
Research & Development Expense:
Total Operating Expenses:
Operating Income:
Income Taxes:
Net Income:
TDW Cash Flow
Enable JavaScript and reload
Operating Activities Net Income:
Depreciation, Depletion & Amortization:
Change in Accounts Receiveable:
Net Cash from Operations:
Repurchases/Buybacks Common Stock:
Issuance of Long-term Debt:
Cash Dividends Paid:
Net Cash from Financing Activities:
Property, Plant & Equipment Purchases:
Purchases of Businesses, Net of Cash:
Net Cash from Investing Activities:
Net Change in Cash & Equivalents:
TDW Balance Sheet
Enable JavaScript and reload
Cash and Cash Equivalents:
Short-Term Investments:
Accounts Receivable, Net:
Inventories:
Total Current Assets:
Property, Plant & Equipment, Net:
Total Assets:
Accounts Payable:
Current Portion of Long-Term Debt:
Total Short-Term Liabilities:
Long Term Debt, Non-Current Portion:
Total Long-Term Liabilities:
Total Liabilities:
COMPANY PROFILE
( 1)
INTERIM FINANCIAL STATEMENTS
The unaudited condensed consolidated financial statements for the interim periods presented herein have been prepared in conformity with United States generally accepted accounting principles and, in the opinion of management, include all adjustments (consisting only of normal recurring adjustments) necessary for a fair statement of the unaudited condensed consolidated financial statements at the dates and for the periods indicated as required by Rule 10 - 01 of Regulation S- X of the Securities and Exchange Commission (SEC). Results of operations for interim periods are not necessarily indicative of results of operations for the respective full years. These unaudited condensed consolidated financial statements should be read in conjunction with the consolidated financial statements and notes thereto in our Annual Report on Form 10 -K for the year ended December 31, 2021, filed with the SEC on March 9, 2022.
The unaudited condensed consolidated financial statements include the accounts of Tidewater Inc. and its subsidiaries. Intercompany balances and transactions are eliminated in consolidation. We use the equity method to account for equity investments over which we exercise significant influence but do not exercise control and are not the primary beneficiary. Unless otherwise specified, all per share information included in this document is on a diluted earnings per share basis.
Free historical financial statements for Tidewater Inc. See how revenue, income, cash flow, and balance sheet financials have changed over 33 quarters since 2018. Compare with TDW stock chart to see long term trends.
Data imported from Tidewater Inc SEC filings. Check original filings before making any investment decision.