Technology › Wholesale-Electronic Parts And Equipment, Nec

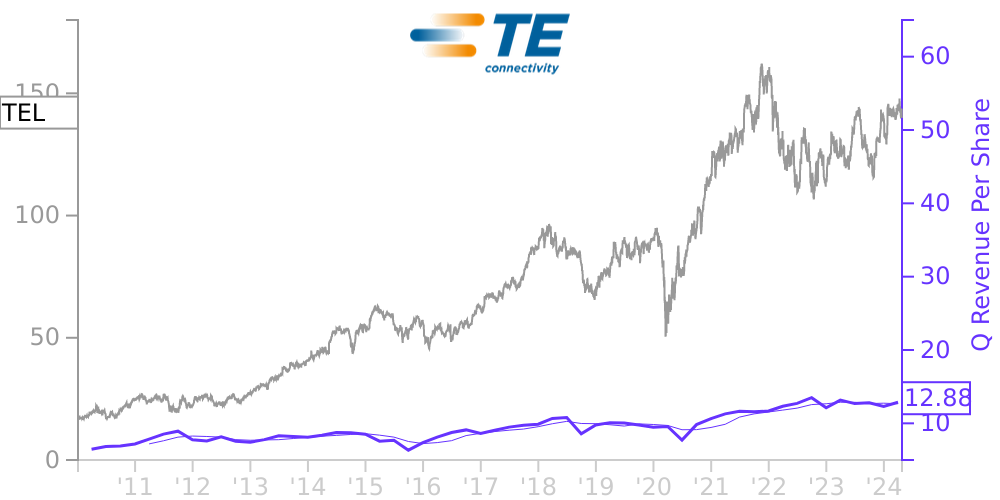
TEL Stock Price Correlated With TE Connectivity Financials
External Links ⌄
Income Statement
Cash Flow
Balance Sheet
TEL Income Statement
Enable JavaScript and reload
Revenue, Net:
Cost of Goods & Services Sold:
Gross Profit:
Selling, General & Admin Expense:
Research & Development Expense:
Total Operating Expenses:
Operating Income:
Income Taxes:
Net Income:
TEL Cash Flow
Enable JavaScript and reload
Operating Activities Net Income:
Depreciation, Depletion & Amortization:
Change in Accounts Receiveable:
Net Cash from Operations:
Repurchases/Buybacks Common Stock:
Issuance of Long-term Debt:
Cash Dividends Paid:
Net Cash from Financing Activities:
Property, Plant & Equipment Purchases:
Purchases of Businesses, Net of Cash:
Net Cash from Investing Activities:
Net Change in Cash & Equivalents:
TEL Balance Sheet
Enable JavaScript and reload
Cash and Cash Equivalents:
Short-Term Investments:
Accounts Receivable, Net:
Inventories:
Total Current Assets:
Property, Plant & Equipment, Net:
Total Assets:
Accounts Payable:
Current Portion of Long-Term Debt:
Total Short-Term Liabilities:
Long Term Debt, Non-Current Portion:
Total Long-Term Liabilities:
Total Liabilities:
COMPANY PROFILE
1. Basis of Presentation The Consolidated Financial Statements reflect the consolidated operations of TE Connectivity Ltd. and its subsidiaries and have been prepared in United States (“U.S.”) dollars in accordance with accounting principles generally accepted in the U.S. (“GAAP”). Description of the Business TE Connectivity Ltd. (“TE Connectivity” or the “Company,” which may be referred to as “we,” “us,” or “our”) is a global industrial technology leader creating a safer, sustainable, productive, and connected future. Our broad range of connectivity and sensor solutions, proven in the harshest environments, enable advancements in transportation, industrial applications, medical technology, energy, data communications, and the home. We operate through three reportable segments: ● Transportation Solutions —The Transportation Solutions segment is a leader in connectivity and sensor technologies. Our products, which must withstand harsh conditions, are used in the automotive, commercial transportation, and sensors markets. ● Industrial Solutions —The Industrial Solutions segment is a leading supplier of products that connect and distribute power, data, and signals. Our products are used in the industrial equipment; aerospace, defense, oil, and gas; energy; and medical markets. ● Communications Solutions —The Communications Solutions segment is a leading supplier of electronic components for the data and devices and the appliances markets. Use of Estimates The preparation of the Consolidated Financial Statements in conformity with GAAP requires management to make estimates and assumptions that affect the reported amounts of assets and liabilities, the disclosure of contingent assets and liabilities, and the reported amounts of revenues and expenses. Actual results could differ from these estimates. Fiscal Year We have a 52- or 53-week fiscal year that ends on the last Friday of September. Fiscal 2021, 2020, and 2019 were each 52 weeks in length and ended on September 24, 2021, September 25, 2020, and September 27, 2019, respectively. For fiscal years in which there are 53 weeks, the fourth fiscal quarter includes 14 weeks, with the next such occurrence taking place in fiscal 2022.
Free historical financial statements for TE Connectivity Ltd. See how revenue, income, cash flow, and balance sheet financials have changed over 66 quarters since 2009. Compare with TEL stock chart to see long term trends.
Data imported from TE Connectivity Ltd SEC filings. Check original filings before making any investment decision.