Industrials › Industrial Trucks Tractors Trailers And Stackers

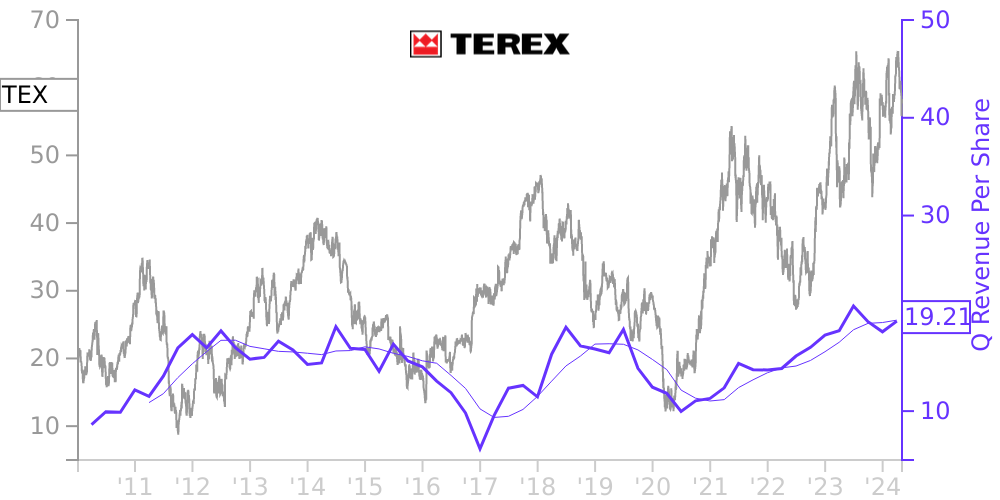
TEX Stock Price Correlated With Terex Financials
External Links ⌄
Income Statement
Cash Flow
Balance Sheet
TEX Income Statement
Enable JavaScript and reload
Revenue, Net:
Cost of Goods & Services Sold:
Gross Profit:
Selling, General & Admin Expense:
Research & Development Expense:
Total Operating Expenses:
Operating Income:
Income Taxes:
Net Income:
TEX Cash Flow
Enable JavaScript and reload
Operating Activities Net Income:
Depreciation, Depletion & Amortization:
Change in Accounts Receiveable:
Net Cash from Operations:
Repurchases/Buybacks Common Stock:
Issuance of Long-term Debt:
Cash Dividends Paid:
Net Cash from Financing Activities:
Property, Plant & Equipment Purchases:
Purchases of Businesses, Net of Cash:
Net Cash from Investing Activities:
Net Change in Cash & Equivalents:
TEX Balance Sheet
Enable JavaScript and reload
Cash and Cash Equivalents:
Short-Term Investments:
Accounts Receivable, Net:
Inventories:
Total Current Assets:
Property, Plant & Equipment, Net:
Total Assets:
Accounts Payable:
Current Portion of Long-Term Debt:
Total Short-Term Liabilities:
Long Term Debt, Non-Current Portion:
Total Long-Term Liabilities:
Total Liabilities:
COMPANY PROFILE
BASIS OF PRESENTATION Basis of Presentation and Principles of Consolidation . The consolidated financial statements include the accounts of Terex Corporation, its majority-owned subsidiaries and other controlled subsidiaries (“Terex” or the “Company”). The Company consolidates all majority-owned and controlled subsidiaries, applies equity method of accounting for investments in which the Company is able to exercise significant influence and applies the cost method for investments which do not have readily determinable fair values. All intercompany balances, transactions and profits have been eliminated. Certain prior period amounts have been reclassified to conform with the 2021 presentation.
As further described in Note D – “Acquisitions and Discontinued Operations”, on July 31, 2019, the Company completed the disposition of its Demag ® mobile cranes business (“Demag”) to Tadano Ltd. and certain of its subsidiaries (“Tadano”). During 2019, the Company also exited North American mobile crane product lines manufactured in its Oklahoma City facility. As a result, the Company reported these operations, formerly part of the Cranes segment, in discontinued operations in the Consolidated Statement of Income (Loss) for all periods presented. Residual assets and liabilities were recorded within Prepaid and other current assets, Other assets, Other current liabilities and Other non-current liabilities in the Consolidated Balance Sheet at December 31, 2020. See Note D – “Acquisitions and Discontinued Operations” for further information.
Use of Estimates. The preparation of financial statements in conformity with generally accepted accounting principles (“U.S. GAAP”) requires management to make estimates and assumptions that affect reported amounts of assets and liabilities and disclosure of contingent assets and liabilities at the date of the financial statements and the reported amounts of revenues and expenses during the reporting period. Actual amounts could differ from those estimates.
Cash and Cash Equivalents. Cash equivalents consist of highly liquid investments with original maturities of three months or less. Carrying amount of cash and cash equivalents approximates its fair value. Cash and cash equivalents include $3.7 million and $5.0 million at December 31, 2021 and 2020, respectively, which were not immediately available for use. These consist primarily of cash balances held in escrow to secure various obligations of the Company.
Inventories. Inventories are stated at the lower of cost or net realizable value (“NRV”). Cost is determined by the first-in, first-out (“FIFO”) and average cost methods (approximately 93% and 7%, respectively). In valuing inventory, the Company is required to make assumptions regarding the level of reserves required to value potentially obsolete or over-valued items at lower of cost or NRV. These assumptions require the Company to analyze the aging of and forecasted demand for its inventory, forecast future product sales prices, pricing trends and margins, and to make judgments and estimates regarding obsolete or excess inventory. Future product sales prices, pricing trends and margins are based on historical experience and actual orders received. The Company’s judgments and estimates for excess or obsolete inventory are based on analysis of actual and forecasted usage. Valuation of used equipment taken in trade from customers requires the Company to use the best information available to determine the value of the equipment to potential customers. This value is subject to change based on numerous conditions. Inventory reserves are established taking into account age, frequency of use, or sale, and in the case of repair parts, installed base of machines. While calculations are made involving these factors, significant management judgment regarding expectations for future events is involved. Future events that could significantly influence the Company’s judgment and related
Free historical financial statements for Terex Corp. See how revenue, income, cash flow, and balance sheet financials have changed over 65 quarters since 2010. Compare with TEX stock chart to see long term trends.
Data imported from Terex Corp SEC filings. Check original filings before making any investment decision.