Industrials › Electrical Industrial Apparatus

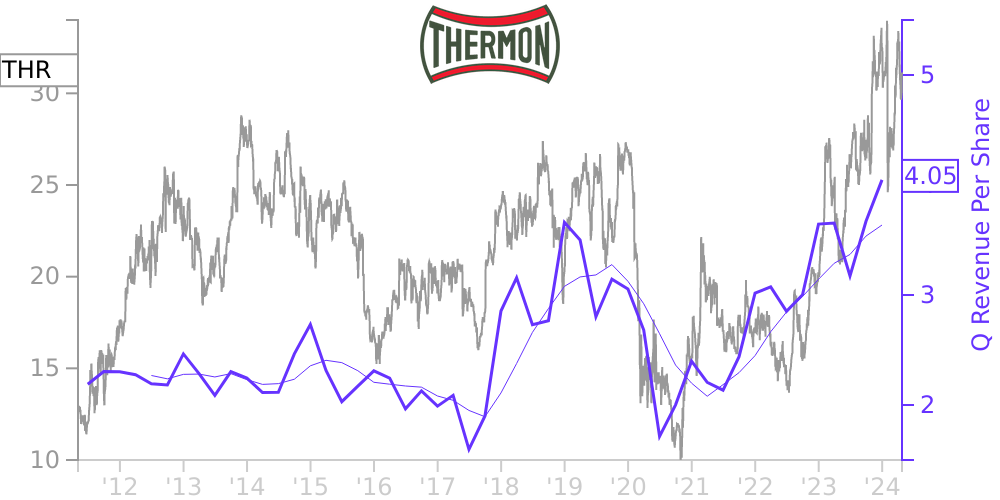
THR Stock Price Correlated With Thermon Group Holdings Financials
External Links ⌄
Income Statement
Cash Flow
Balance Sheet
THR Income Statement
Enable JavaScript and reload
Revenue, Net:
Cost of Goods & Services Sold:
Gross Profit:
Selling, General & Admin Expense:
Research & Development Expense:
Total Operating Expenses:
Operating Income:
Income Taxes:
Net Income:
THR Cash Flow
Enable JavaScript and reload
Operating Activities Net Income:
Depreciation, Depletion & Amortization:
Change in Accounts Receiveable:
Net Cash from Operations:
Repurchases/Buybacks Common Stock:
Issuance of Long-term Debt:
Cash Dividends Paid:
Net Cash from Financing Activities:
Property, Plant & Equipment Purchases:
Purchases of Businesses, Net of Cash:
Net Cash from Investing Activities:
Net Change in Cash & Equivalents:
THR Balance Sheet
Enable JavaScript and reload
Cash and Cash Equivalents:
Short-Term Investments:
Accounts Receivable, Net:
Inventories:
Total Current Assets:
Property, Plant & Equipment, Net:
Total Assets:
Accounts Payable:
Current Portion of Long-Term Debt:
Total Short-Term Liabilities:
Long Term Debt, Non-Current Portion:
Total Long-Term Liabilities:
Total Liabilities:
COMPANY PROFILE
Basis of Presentation Thermon Group Holdings, Inc. and its direct and indirect subsidiaries are referred to collectively as “we,” “our,” or the “Company” herein. We are one of the largest providers of highly engineered industrial process heating solutions for process industries. We offer a full suite of products (heating units, heating cables, temporary power solutions, tubing bundles, industrial heating blankets and chillers), services (engineering, installation and maintenance services) and software (design optimization and wireless and network control systems) required to deliver comprehensive solutions to some of the world's largest and most complex projects.
Our condensed consolidated financial statements are prepared in conformity with generally accepted accounting principles in the United States ("GAAP") and the requirements of the United States Securities and Exchange Commission ("SEC") for interim financial information. Accordingly, the accompanying condensed consolidated financial statements do not include all disclosures required for full annual financial statements and should be read in conjunction with our audited consolidated financial statements and notes thereto for the fiscal year ended March 31, 2022 ("fiscal 2022"). In our opinion, the accompanying condensed consolidated financial statements reflect all adjustments considered necessary to present fairly our financial position at June 30, 2022 and March 31, 2022, and the results of our operations for the three months ended June 30, 2022 and 2021. Certain prior year amounts have been reclassified to conform with the current year's presentation.
Impact of the COVID-19 Pandemic and General Economic Environment
The COVID-19 pandemic and the measures being taken to address and limit the spread of the virus have adversely affected the economies and financial markets of many countries, resulting in an economic downturn that negatively impacted, and may continue to negatively impact, global demand for our products and services. We are still experiencing effects of lockdowns in Asia and Australia, which are impacting our results in our Asia-Pacific ("APAC") segment. The effect of loosening pandemic restrictions outside of APAC, along with pent-up demand from periods of stagnant lockdown and uncertainty have combined to strengthen customer demand from most regions we serve, especially in North America. During periods of the pandemic we have experienced, and may experience in the future, a decline in the demand of our products and services or disruptions in raw materials or labor required for manufacturing that has in the past, and may in the future, materially and negatively impact our business, financial condition, results of operation and overall financial performance. We have experienced increased costs across our global supply chain as we focus on meeting growing demand from our customers. In certain circumstances, we have had issues with a lack of availability of certain raw materials as well as increases in costs of our raw materials due to: use of alternate suppliers, higher freight costs, increased lead times, and expedited shipping. We continue to monitor the pandemic restrictions and other effects the pandemic may have on our business.
On April 11, 2020, the Canadian government officially enacted the Canadian Emergency Wage Subsidy (the “CEWS”) for the purposes of assisting employers in financial hardship due to the COVID-19 pandemic and of reducing potential layoffs of employees.
We recorded no transactions related to CEWS for the three months ended June 30, 2022. We recorded $701 to "Cost of sales" in our condensed consolidated statement of operations for the three months ended June 30, 2021. We recorded $314 to "Selling, general and administrative expenses" in our condensed consolidated statement of operations for the three months ended June 30, 2021. Additionally, we capitalized $0 and $2 in "Inventories, net" at June 30, 2022 and March 31, 2022, res
Free historical financial statements for Thermon Group Holdings Inc. See how revenue, income, cash flow, and balance sheet financials have changed over 60 quarters since 2011. Compare with THR stock chart to see long term trends.
Data imported from Thermon Group Holdings Inc SEC filings. Check original filings before making any investment decision.