Consumer Discretionary › Operative Builders

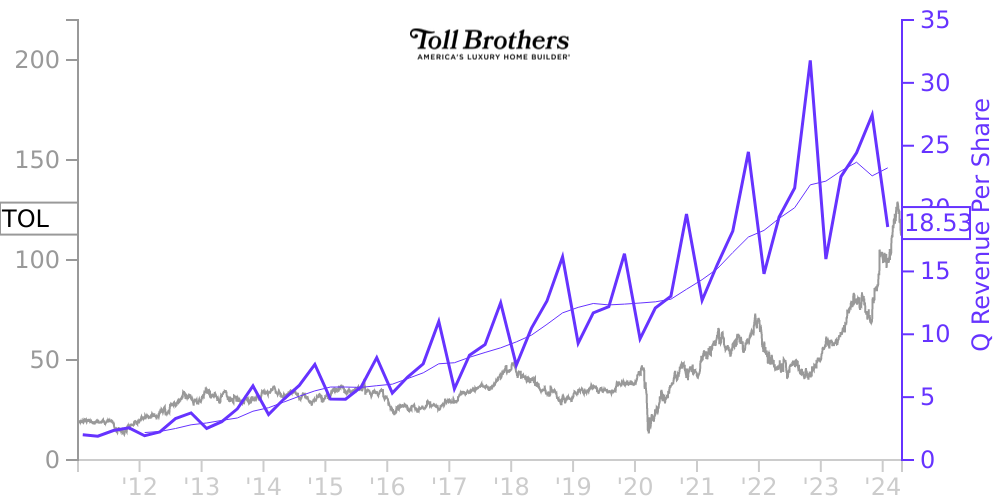
TOL Stock Price Correlated With Toll Brothers Financials
External Links ⌄
Income Statement
Cash Flow
Balance Sheet
TOL Income Statement
Enable JavaScript and reload
Revenue, Net:
Cost of Goods & Services Sold:
Gross Profit:
Selling, General & Admin Expense:
Research & Development Expense:
Total Operating Expenses:
Operating Income:
Income Taxes:
Net Income:
TOL Cash Flow
Enable JavaScript and reload
Operating Activities Net Income:
Depreciation, Depletion & Amortization:
Change in Accounts Receiveable:
Net Cash from Operations:
Repurchases/Buybacks Common Stock:
Issuance of Long-term Debt:
Cash Dividends Paid:
Net Cash from Financing Activities:
Property, Plant & Equipment Purchases:
Purchases of Businesses, Net of Cash:
Net Cash from Investing Activities:
Net Change in Cash & Equivalents:
TOL Balance Sheet
Enable JavaScript and reload
Cash and Cash Equivalents:
Short-Term Investments:
Accounts Receivable, Net:
Inventories:
Total Current Assets:
Property, Plant & Equipment, Net:
Total Assets:
Accounts Payable:
Current Portion of Long-Term Debt:
Total Short-Term Liabilities:
Long Term Debt, Non-Current Portion:
Total Long-Term Liabilities:
Total Liabilities:
COMPANY PROFILE
Basis of Presentation
The accompanying condensed consolidated financial statements include the accounts of Toll Brothers, Inc. (the “Company,” “we,” “us,” or “our”), a Delaware corporation, and its majority-owned subsidiaries. All significant intercompany accounts and transactions have been eliminated. Investments in 50% or less owned partnerships and affiliates are accounted for using the equity method unless it is determined that we have effective control of the entity, in which case we would consolidate the entity.
The accompanying unaudited condensed consolidated financial statements have been prepared in accordance with the rules and regulations of the Securities and Exchange Commission (“SEC”) for interim financial information. The October 31, 2017 balance sheet amounts and disclosures included herein have been derived from our October 31, 2017 audited financial statements. Since the accompanying condensed consolidated financial statements do not include all the information and footnotes required by U.S. generally accepted accounting principles (“GAAP”) for complete financial statements, we suggest that they be read in conjunction with the consolidated financial statements and notes thereto included in our Annual Report on Form 10-K for the fiscal year ended October 31, 2017 (“ 2017 Form 10-K”). In the opinion of management, the accompanying unaudited condensed consolidated financial statements include all adjustments, which are of a normal recurring nature, necessary to present fairly our financial position as of January 31, 2018 ; the results of our operations for the three -month periods ended January 31, 2018 and 2017 ; and our cash flows for the three -month periods ended January 31, 2018 and 2017 . The results of operations for such interim periods are not necessarily indicative of the results to be expected for the full year.
Free historical financial statements for Toll Brothers Inc. See how revenue, income, cash flow, and balance sheet financials have changed over 62 quarters since 2011. Compare with TOL stock chart to see long term trends.
Data imported from Toll Brothers Inc SEC filings. Check original filings before making any investment decision.