Industrials › Lumber And Wood Products (No Furniture)

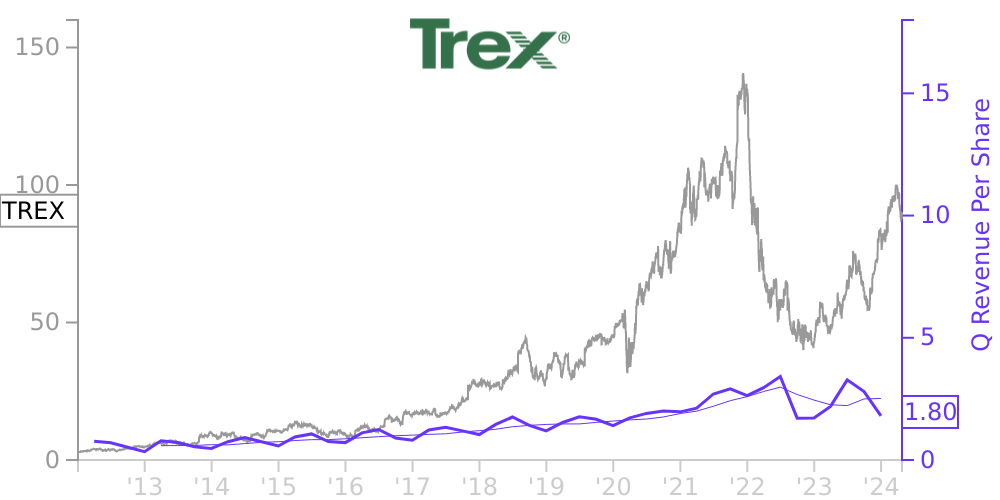
TREX Stock Price Correlated With Trex Co. Financials
External Links ⌄
Income Statement
Cash Flow
Balance Sheet
TREX Income Statement
Enable JavaScript and reload
Revenue, Net:
Cost of Goods & Services Sold:
Gross Profit:
Selling, General & Admin Expense:
Research & Development Expense:
Total Operating Expenses:
Operating Income:
Income Taxes:
Net Income:
TREX Cash Flow
Enable JavaScript and reload
Operating Activities Net Income:
Depreciation, Depletion & Amortization:
Change in Accounts Receiveable:
Net Cash from Operations:
Repurchases/Buybacks Common Stock:
Issuance of Long-term Debt:
Cash Dividends Paid:
Net Cash from Financing Activities:
Property, Plant & Equipment Purchases:
Purchases of Businesses, Net of Cash:
Net Cash from Investing Activities:
Net Change in Cash & Equivalents:
TREX Balance Sheet
Enable JavaScript and reload
Cash and Cash Equivalents:
Short-Term Investments:
Accounts Receivable, Net:
Inventories:
Total Current Assets:
Property, Plant & Equipment, Net:
Total Assets:
Accounts Payable:
Current Portion of Long-Term Debt:
Total Short-Term Liabilities:
Long Term Debt, Non-Current Portion:
Total Long-Term Liabilities:
Total Liabilities:
COMPANY PROFILE
2.
BASIS OF PRESENTATION
The accompanying unaudited condensed consolidated financial statements have been prepared in accordance with accounting principles generally accepted in the United States for interim financial information and the instructions to Form 10-Q
and Article 10 of Regulation S-X
and, accordingly, the accompanying unaudited condensed consolidated financial statements do not include all of the information and notes required by accounting principles generally accepted in the United States for complete financial statements. In the opinion of management, all adjustments (consisting of normal and recurring adjustments, except as otherwise described herein) considered necessary for a fair presentation have been included in the accompanying unaudited condensed consolidated financial statements. The unaudited condensed consolidated financial statements include the accounts of the Company for all periods presented. Intercompany accounts and transactions have been eliminated in consolidation.
The unaudited consolidated results of operations for the three months ended March 31, 2022 are not necessarily indicative of the results that may be expected for the fiscal year ending December 31, 2022. The Company’s results of operations are affected by a number of factors, including, but not limited to, the cost to manufacture and distribute products, cost of raw materials, inflation, consumer spending and preferences, the impact of any supply chain disruptions, economic conditions, and any adverse effects from the COVID-19
pandemic and geopolitical conflicts.
These unaudited condensed consolidated financial statements should be read in conjunction with the audited consolidated financial statements as of December 31, 2021 and 2020 and for each of the three years in the period ended December 31, 2021 included in the Annual Report of Trex Company, Inc. on Form 10-K,
as filed with the U.S. Securities and Exchange Commission.
Free historical financial statements for Trex Co. Inc.. See how revenue, income, cash flow, and balance sheet financials have changed over 57 quarters since 2012. Compare with TREX stock chart to see long term trends.
Data imported from Trex Co. Inc. SEC filings. Check original filings before making any investment decision.