Energy › Natural Gas Transmission

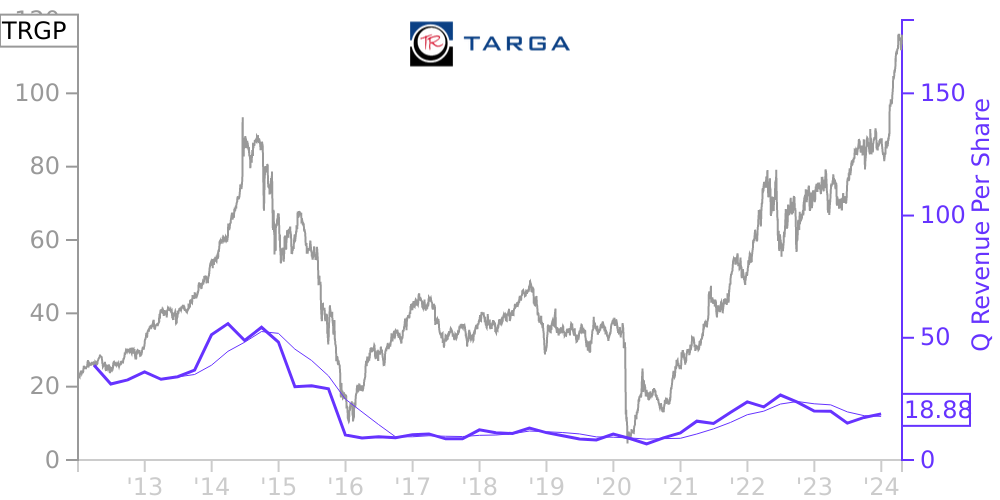
TRGP Stock Price Correlated With Targa Resources Financials
External Links ⌄
Income Statement
Cash Flow
Balance Sheet
TRGP Income Statement
Enable JavaScript and reload
Revenue, Net:
Cost of Goods & Services Sold:
Gross Profit:
Selling, General & Admin Expense:
Research & Development Expense:
Total Operating Expenses:
Operating Income:
Income Taxes:
Net Income:
TRGP Cash Flow
Enable JavaScript and reload
Operating Activities Net Income:
Depreciation, Depletion & Amortization:
Change in Accounts Receiveable:
Net Cash from Operations:
Repurchases/Buybacks Common Stock:
Issuance of Long-term Debt:
Cash Dividends Paid:
Net Cash from Financing Activities:
Property, Plant & Equipment Purchases:
Purchases of Businesses, Net of Cash:
Net Cash from Investing Activities:
Net Change in Cash & Equivalents:
TRGP Balance Sheet
Enable JavaScript and reload
Cash and Cash Equivalents:
Short-Term Investments:
Accounts Receivable, Net:
Inventories:
Total Current Assets:
Property, Plant & Equipment, Net:
Total Assets:
Accounts Payable:
Current Portion of Long-Term Debt:
Total Short-Term Liabilities:
Long Term Debt, Non-Current Portion:
Total Long-Term Liabilities:
Total Liabilities:
COMPANY PROFILE
Note 2 — Basis of Presentation
These accompanying financial statements and related notes present our consolidated financial position as of December 31, 2021 and 2020, and the results of operations, comprehensive income (loss), cash flows, and changes in owners’ equity for the years ended December 31, 2021, 2020 and 2019. We have prepared these consolidated financial statements in accordance with GAAP. All significant intercompany balances and transactions have been eliminated in consolidation.
Certain amounts in prior periods have been reclassified to conform to the current year presentation. Beginning in 2021, we reclassified certain fuel and power costs previously included in Operating expenses to Product purchases and fuel within our Consolidated Statements of Operations to better reflect the direct relationship of these costs to our revenue-generating activities and align with our evaluation of the performance of the business. For the years ended December 31, 2021, 2020 and 2019, we reclassified $64.9 million, $81.4 million and $89.5 million in fuel and power costs, respectively.
Free historical financial statements for Targa Resources Corp. See how revenue, income, cash flow, and balance sheet financials have changed over 57 quarters since 2012. Compare with TRGP stock chart to see long term trends.
Data imported from Targa Resources Corp SEC filings. Check original filings before making any investment decision.