Technology › Measuring And Controlling Devices, Nec

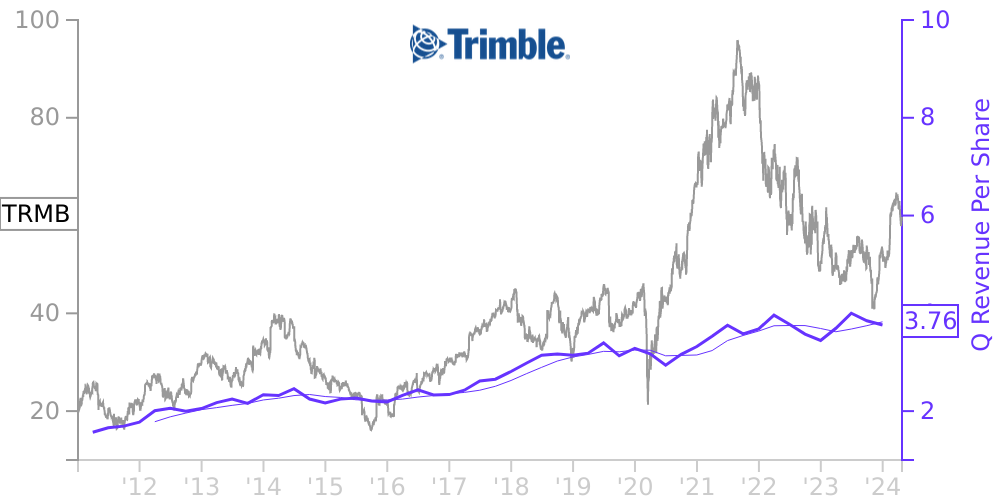
TRMB Stock Price Correlated With Trimble Financials
External Links ⌄
Income Statement
Cash Flow
Balance Sheet
TRMB Income Statement
Enable JavaScript and reload
Revenue, Net:
Cost of Goods & Services Sold:
Gross Profit:
Selling, General & Admin Expense:
Research & Development Expense:
Total Operating Expenses:
Operating Income:
Income Taxes:
Net Income:
TRMB Cash Flow
Enable JavaScript and reload
Operating Activities Net Income:
Depreciation, Depletion & Amortization:
Change in Accounts Receiveable:
Net Cash from Operations:
Repurchases/Buybacks Common Stock:
Issuance of Long-term Debt:
Cash Dividends Paid:
Net Cash from Financing Activities:
Property, Plant & Equipment Purchases:
Purchases of Businesses, Net of Cash:
Net Cash from Investing Activities:
Net Change in Cash & Equivalents:
TRMB Balance Sheet
Enable JavaScript and reload
Cash and Cash Equivalents:
Short-Term Investments:
Accounts Receivable, Net:
Inventories:
Total Current Assets:
Property, Plant & Equipment, Net:
Total Assets:
Accounts Payable:
Current Portion of Long-Term Debt:
Total Short-Term Liabilities:
Long Term Debt, Non-Current Portion:
Total Long-Term Liabilities:
Total Liabilities:
COMPANY PROFILE
OVERVIEW AND BASIS OF PRESENTATION Company and Background
Trimble began operations in 1978 and was originally incorporated in California as Trimble Navigation Limited in 1981. On October 1, 2016, Trimble Navigation Limited changed its name to Trimble Inc. ("Trimble" or the "Company" or “we” or “our” or “us”) and changed its state of incorporation from the State of California to the State of Delaware.
Basis of Presentation
We use a 52- to 53-week fiscal year ending on the Friday nearest to December 31. Fiscal 2020 is a 52-week year ending on January 1, 2021, and fiscal 2019 was a 53-week year ended on January 3, 2020. The quarters ended October 2, 2020 and September 27, 2019 each included 13 weeks. Unless otherwise stated, all dates refer to our fiscal year and fiscal periods.
The Condensed Consolidated Financial Statements include our results and our consolidated subsidiaries. Inter-company accounts and transactions have been eliminated. Noncontrolling interests represent the noncontrolling stockholders’ proportionate share of the net assets and results of operations of our consolidated subsidiaries.
The unaudited interim Condensed Consolidated Financial Statements and accompanying notes are prepared in accordance with U.S. generally accepted accounting principles ("GAAP"). In the opinion of management, the unaudited interim Condensed Consolidated Financial Statements reflect all adjustments of a normal recurring nature that are necessary for a fair presentation of the results for the interim periods presented. Interim results are not necessarily indicative of results for the full year. The information included in this Form 10-Q should be read in conjunction with information included in Trimble's Form 10-K filed with the U.S. Securities and Exchange Commission on February 28, 2020.
Use of Estimates
The preparation of financial statements in accordance with U.S. GAAP requires management to make estimates and assumptions that affect the amounts reported in its Condensed Consolidated Financial Statements and accompanying notes. Estimates and assumptions are used for revenue recognition, including determining the nature and timing of satisfaction of performance obligations and determining standalone selling price of performance obligations, allowances for doubtful accounts, sales returns reserve, inventory valuation, warranty costs, investments, acquired intangibles, goodwill and intangibles impairments, other long-lived asset impairments, stock-based compensation, and income taxes. Management bases its estimates on historical experience and various other assumptions believed to be reasonable. The global economic climate and unanticipated effects from the COVID-19 pandemic make these estimates more complex, and actual results could differ materially from those estimates.
Free historical financial statements for Trimble Inc. See how revenue, income, cash flow, and balance sheet financials have changed over 61 quarters since 2011. Compare with TRMB stock chart to see long term trends.
Data imported from Trimble Inc SEC filings. Check original filings before making any investment decision.