Materials › Industrial Inorganic Chemicals

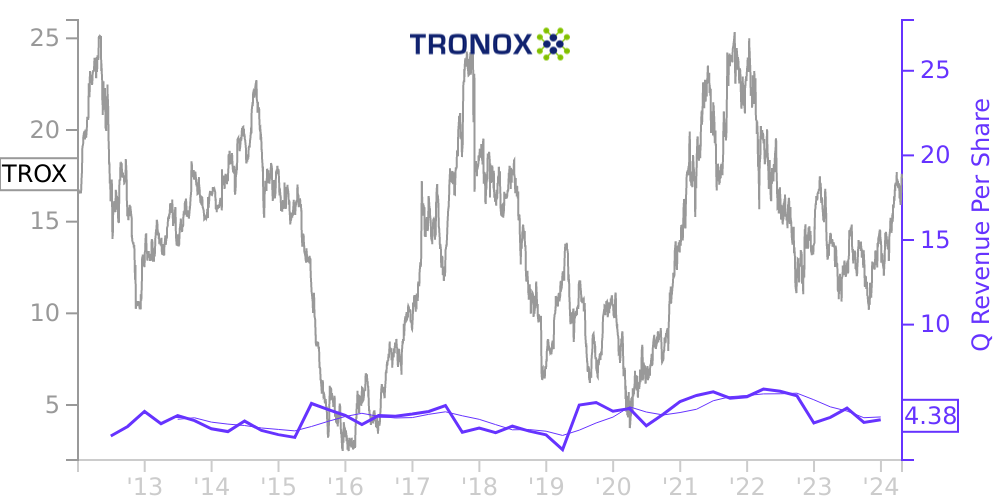
TROX Stock Price Correlated With Tronox Holdings Financials
External Links ⌄
Income Statement
Cash Flow
Balance Sheet
TROX Income Statement
Enable JavaScript and reload
Revenue, Net:
Cost of Goods & Services Sold:
Gross Profit:
Selling, General & Admin Expense:
Research & Development Expense:
Total Operating Expenses:
Operating Income:
Income Taxes:
Net Income:
TROX Cash Flow
Enable JavaScript and reload
Operating Activities Net Income:
Depreciation, Depletion & Amortization:
Change in Accounts Receiveable:
Net Cash from Operations:
Repurchases/Buybacks Common Stock:
Issuance of Long-term Debt:
Cash Dividends Paid:
Net Cash from Financing Activities:
Property, Plant & Equipment Purchases:
Purchases of Businesses, Net of Cash:
Net Cash from Investing Activities:
Net Change in Cash & Equivalents:
TROX Balance Sheet
Enable JavaScript and reload
Cash and Cash Equivalents:
Short-Term Investments:
Accounts Receivable, Net:
Inventories:
Total Current Assets:
Property, Plant & Equipment, Net:
Total Assets:
Accounts Payable:
Current Portion of Long-Term Debt:
Total Short-Term Liabilities:
Long Term Debt, Non-Current Portion:
Total Long-Term Liabilities:
Total Liabilities:
COMPANY PROFILE
The Company Tronox Holdings plc (referred to herein as "Tronox", the "Company", "we", "us", or "our") operates titanium-bearing mineral sand mines and beneficiation operations in Australia, South Africa and Brazil to produce feedstock materials that can be processed into TiO 2 for pigment, high purity titanium chemicals, including titanium tetrachloride, and Ultrafine© titanium dioxide used in certain specialty applications. It is our long-term strategic goal to be vertically integrated and consume all of our feedstock materials in our own nine TiO 2 pigment facilities which we operate in the United States, Australia, Brazil, UK, France, the Netherlands, China and the Kingdom of Saudi Arabia (“KSA”). We believe that vertical integration is the best way to achieve our ultimate goal of delivering low cost, high-quality pigment to our coatings and other TiO 2 customers throughout the world. The mining, beneficiation and smelting of titanium bearing mineral sands creates meaningful quantities of zircon and pig iron, which we also supply to customers around the world.
We are a public limited company listed on the New York Stock Exchange and are registered under the laws of England and Wales.
Basis of Presentation
We are considered a domestic company in the United Kingdom and, as such, are required to comply with filing requirements in the United Kingdom. Additionally, we are not considered a “foreign private issuer” in the U.S.; therefore, we are required to comply with the reporting and other requirements imposed by the U.S. securities law on U.S. domestic issuers, which, among other things, requires reporting under accounting principles generally accepted in the United States of America (“U.S. GAAP”). The consolidated financial statements included in this Form 10-K are prepared in conformity with U.S. GAAP.
Our consolidated financial statements include the accounts of all majority-owned subsidiary companies. All intercompany balances and transactions have been eliminated in consolidation. Certain prior period amounts have been reclassified to conform to the manner and presentation in the current period.
Use of Estimates
The preparation of financial statements in conformity with U.S. GAAP requires management to make estimates and assumptions that affect the reported amounts of assets and liabilities, the disclosure of contingent assets and liabilities at the date of the financial statements, and the reported amounts of revenues and expenses during the reporting periods. It is at least reasonably possible that the effect on the financial statements of a change in estimate due to one or more future confirming events could have a material effect on the financial statements.
Free historical financial statements for Tronox Holdings plc. See how revenue, income, cash flow, and balance sheet financials have changed over 56 quarters since 2012. Compare with TROX stock chart to see long term trends.
Data imported from Tronox Holdings plc SEC filings. Check original filings before making any investment decision.