Materials › Metal Forging And Stampings

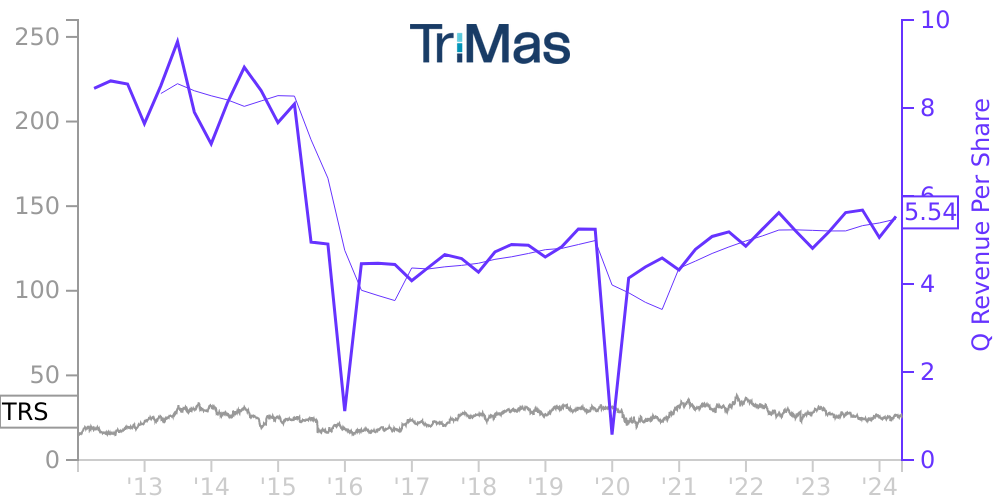
TRS Stock Price Correlated With TriMas Financials
External Links ⌄
Income Statement
Cash Flow
Balance Sheet
TRS Income Statement
Enable JavaScript and reload
Revenue, Net:
Cost of Goods & Services Sold:
Gross Profit:
Selling, General & Admin Expense:
Research & Development Expense:
Total Operating Expenses:
Operating Income:
Income Taxes:
Net Income:
TRS Cash Flow
Enable JavaScript and reload
Operating Activities Net Income:
Depreciation, Depletion & Amortization:
Change in Accounts Receiveable:
Net Cash from Operations:
Repurchases/Buybacks Common Stock:
Issuance of Long-term Debt:
Cash Dividends Paid:
Net Cash from Financing Activities:
Property, Plant & Equipment Purchases:
Purchases of Businesses, Net of Cash:
Net Cash from Investing Activities:
Net Change in Cash & Equivalents:
TRS Balance Sheet
Enable JavaScript and reload
Cash and Cash Equivalents:
Short-Term Investments:
Accounts Receivable, Net:
Inventories:
Total Current Assets:
Property, Plant & Equipment, Net:
Total Assets:
Accounts Payable:
Current Portion of Long-Term Debt:
Total Short-Term Liabilities:
Long Term Debt, Non-Current Portion:
Total Long-Term Liabilities:
Total Liabilities:
COMPANY PROFILE
Basis of PresentationTriMas Corporation ("TriMas" or the "Company"), and its consolidated subsidiaries, designs, engineers and manufactures innovative products under leading brand names for customers primarily in the consumer products, aerospace & defense, and industrial markets.The preparation of financial statements requires management of the Company to make estimates and assumptions that affect the reported amounts of assets and liabilities. Actual results may differ from such estimates and assumptions due to risks and uncertainties, including uncertainty in the current economic environment due to the ongoing outbreak of the coronavirus and related variants (“COVID-19”). While the full impact of the COVID-19 pandemic is unknown and cannot be reasonably estimated at this time, the Company has made appropriate accounting estimates based on the facts and circumstances available as of the reporting date. To the extent there are differences between these estimates and actual results, the Company's consolidated financial statements may be materially affected.
Free historical financial statements for TriMas Corp.. See how revenue, income, cash flow, and balance sheet financials have changed over 57 quarters since 2012. Compare with TRS stock chart to see long term trends.
Data imported from TriMas Corp. SEC filings. Check original filings before making any investment decision.