Technology › Special Industry Machinery, Nec

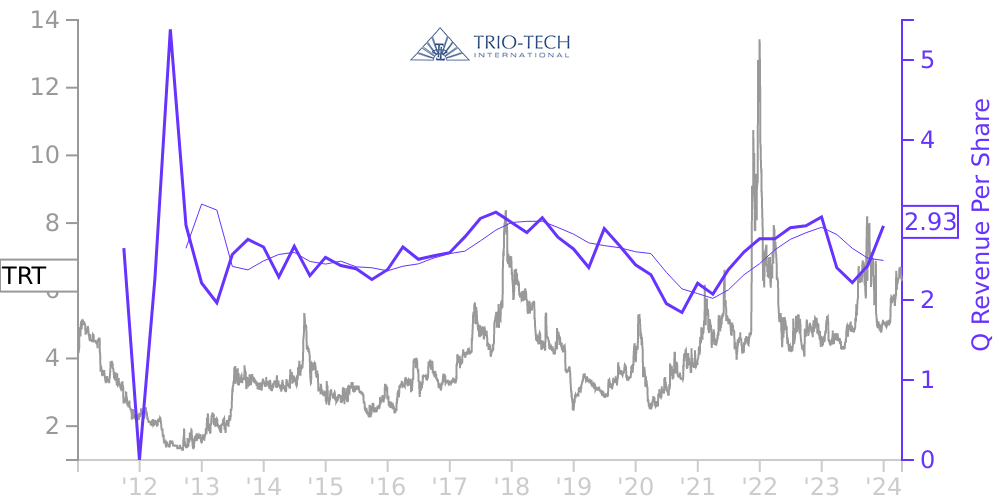
TRT Stock Price Correlated With Trio-Tech International Financials
External Links ⌄
Income Statement
Cash Flow
Balance Sheet
TRT Income Statement
Enable JavaScript and reload
Revenue, Net:
Cost of Goods & Services Sold:
Gross Profit:
Selling, General & Admin Expense:
Research & Development Expense:
Total Operating Expenses:
Operating Income:
Income Taxes:
Net Income:
TRT Cash Flow
Enable JavaScript and reload
Operating Activities Net Income:
Depreciation, Depletion & Amortization:
Change in Accounts Receiveable:
Net Cash from Operations:
Repurchases/Buybacks Common Stock:
Issuance of Long-term Debt:
Cash Dividends Paid:
Net Cash from Financing Activities:
Property, Plant & Equipment Purchases:
Purchases of Businesses, Net of Cash:
Net Cash from Investing Activities:
Net Change in Cash & Equivalents:
TRT Balance Sheet
Enable JavaScript and reload
Cash and Cash Equivalents:
Short-Term Investments:
Accounts Receivable, Net:
Inventories:
Total Current Assets:
Property, Plant & Equipment, Net:
Total Assets:
Accounts Payable:
Current Portion of Long-Term Debt:
Total Short-Term Liabilities:
Long Term Debt, Non-Current Portion:
Total Long-Term Liabilities:
Total Liabilities:
COMPANY PROFILE
Basis of Presentation
and Principles of Consolidation - Trio-Tech International (the “Company” or “TTI” hereafter) was incorporated
in fiscal 1958 under the laws of the State of California. TTI provides third-party semiconductor testing and burn-in services primarily
through its laboratories in Southeast Asia. In addition, TTI operates testing facilities in the United States. The Company also
designs, develops, manufactures and markets a broad range of equipment and systems used in the manufacturing and testing of semiconductor
devices and electronic components. In fiscal 2021, TTI conducted business in four business segments: manufacturing, testing services,
distribution and real estate. TTI has subsidiaries in the U.S., Singapore, Malaysia, Thailand, Indonesia, Ireland and China as follows: Ownership Location Express Test Corporation (Dormant) 100% Van Nuys, California Trio-Tech Reliability Services (Dormant) 100% Van Nuys, California KTS Incorporated, dba Universal Systems (Dormant) 100% Van Nuys, California European Electronic Test Centre (Dormant) 100% Dublin, Ireland Trio-Tech International Pte. Ltd. 100% Singapore Universal (Far East) Pte. Ltd. * 100% Singapore Trio-Tech International (Thailand) Co. Ltd. * 100% Bangkok, Thailand Trio-Tech (Bangkok) Co. Ltd.* 100% Bangkok, Thailand Trio-Tech (Malaysia)
Sdn. Bhd. (55% owned by Trio-Tech
International Pte. Ltd.) 55% Penang and Selangor, Malaysia Trio-Tech (Kuala Lumpur) Sdn. Bhd. 55% Selangor, Malaysia (100% owned by Trio-Tech Malaysia Sdn. Bhd.) Prestal Enterprise Sdn. Bhd. 76% Selangor, Malaysia (76% owned by Trio-Tech International Pte. Ltd.) Trio-Tech (SIP) Co., Ltd. * 100% Suzhou, China Trio-Tech (Chongqing) Co. Ltd. * 100% Chongqing, China SHI International
Pte. Ltd. (Dormant) (55% owned by Trio-Tech
International Pte. Ltd) 55% Singapore PT SHI Indonesia (Dormant) (100% owned by SHI
International Pte. Ltd.) 55% Batam, Indonesia Trio-Tech (Tianjin) Co., Ltd. * 100% Tianjin, China * 100% owned by Trio-Tech International Pte.
Ltd. The consolidated financial statements are
prepared in accordance with accounting principles generally accepted in the United States of America (“U.S. GAAP’’).
The basis of accounting differs from that used in the statutory financial statements of the Company’s subsidiaries and equity investee
companies, which are prepared in accordance with the accounting principles generally accepted in their respective countries of incorporation.
In the opinion of management, the consolidated financial statements have reflected all costs incurred by the Company and its subsidiaries
in operating the business. All dollar amounts in
the consolidated financial statements and in the notes herein are presented in thousands of United States dollars (US$’000) unless
otherwise designated. Liquidity –
The Company incurred net loss attributable to common shareholders of $591 and net income attributable to common shareholders of $878
for fiscal years 2021 and 2020, respectively. The Company’s core
businesses - testing services, manufacturing and distribution - operate in a volatile industry, whereby its average selling prices and
product costs are influenced by competitive factors. These factors create pressures on sales, costs, earnings and cash flows, which will
impact liquidity. Foreign Currency Translation
and Transactions — The U.S. dollar is the functional currency of the U.S. parent company. The Singapore dollar,
the national currency of Singapore, is the primary currency of the economic environment in which the operations in Singapore are conducted.
The Company also has business entities in Malaysia, Thailand, China and Indonesia of which the Malaysian ringgit (“RM”),
Thai baht, Chinese renminbi (“RMB”) and Indonesian rupiah, are the national currencies. The Company uses the U.S. dollar
for financial reporting purposes. The Company translates
assets and liabilities of its subsidiaries outside the U.S. into U.S. dollars using the rate of exch
Free historical financial statements for Trio-Tech International. See how revenue, income, cash flow, and balance sheet financials have changed over 59 quarters since 2011. Compare with TRT stock chart to see long term trends.
Data imported from Trio-Tech International SEC filings. Check original filings before making any investment decision.