Industrials › Services-Engineering Services

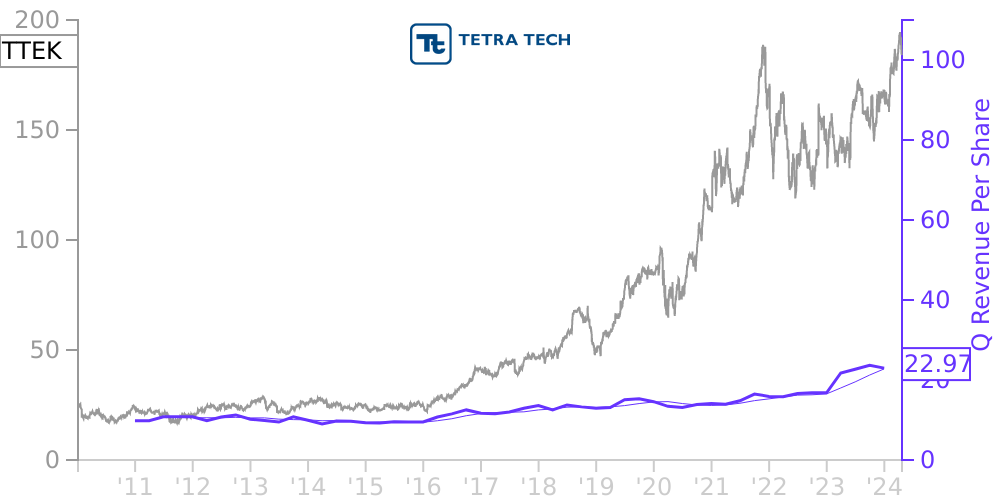
TTEK Stock Price Correlated With Tetra Tech Financials
External Links ⌄
Income Statement
Cash Flow
Balance Sheet
TTEK Income Statement
Enable JavaScript and reload
Revenue, Net:
Cost of Goods & Services Sold:
Gross Profit:
Selling, General & Admin Expense:
Research & Development Expense:
Total Operating Expenses:
Operating Income:
Income Taxes:
Net Income:
TTEK Cash Flow
Enable JavaScript and reload
Operating Activities Net Income:
Depreciation, Depletion & Amortization:
Change in Accounts Receiveable:
Net Cash from Operations:
Repurchases/Buybacks Common Stock:
Issuance of Long-term Debt:
Cash Dividends Paid:
Net Cash from Financing Activities:
Property, Plant & Equipment Purchases:
Purchases of Businesses, Net of Cash:
Net Cash from Investing Activities:
Net Change in Cash & Equivalents:
TTEK Balance Sheet
Enable JavaScript and reload
Cash and Cash Equivalents:
Short-Term Investments:
Accounts Receivable, Net:
Inventories:
Total Current Assets:
Property, Plant & Equipment, Net:
Total Assets:
Accounts Payable:
Current Portion of Long-Term Debt:
Total Short-Term Liabilities:
Long Term Debt, Non-Current Portion:
Total Long-Term Liabilities:
Total Liabilities:
COMPANY PROFILE
Tetra Tech is a leading provider of high-end consulting and engineering services for projects worldwide. With 27,000 associates working together, Tetra Tech provides clear solutions to complex problems in water, environment, sustainable infrastructure, renewable energy, and international development. We are Leading with Science® to provide sustainable and resilient solutions for our clients.
Free historical financial statements for Tetra Tech Inc. See how revenue, income, cash flow, and balance sheet financials have changed over 62 quarters since 2010. Compare with TTEK stock chart to see long term trends.
Data imported from Tetra Tech Inc SEC filings. Check original filings before making any investment decision.