
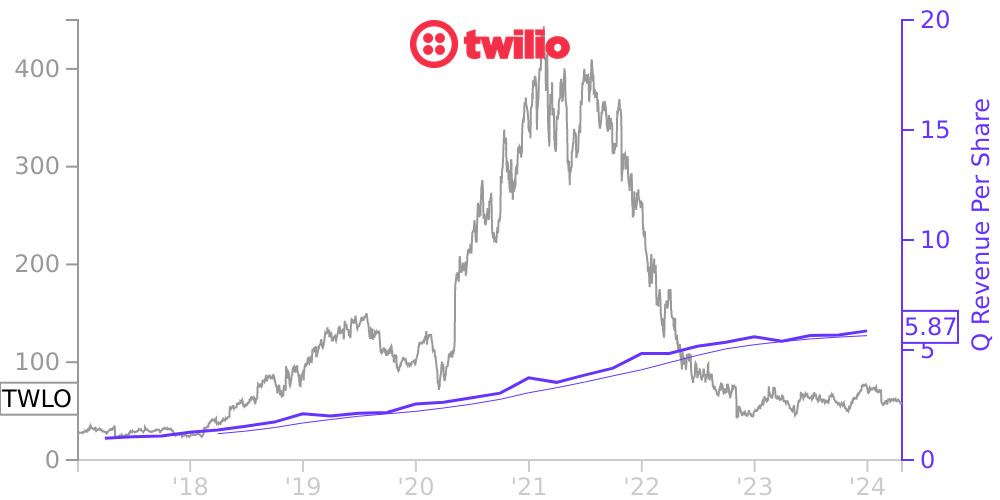
TWLO Stock Price Correlated With Twilio Financials
External Links ⌄
Income Statement
Cash Flow
Balance Sheet
TWLO Income Statement
Enable JavaScript and reload
Revenue, Net:
Cost of Goods & Services Sold:
Gross Profit:
Selling, General & Admin Expense:
Research & Development Expense:
Total Operating Expenses:
Operating Income:
Income Taxes:
Net Income:
TWLO Cash Flow
Enable JavaScript and reload
Operating Activities Net Income:
Depreciation, Depletion & Amortization:
Change in Accounts Receiveable:
Net Cash from Operations:
Repurchases/Buybacks Common Stock:
Issuance of Long-term Debt:
Cash Dividends Paid:
Net Cash from Financing Activities:
Property, Plant & Equipment Purchases:
Purchases of Businesses, Net of Cash:
Net Cash from Investing Activities:
Net Change in Cash & Equivalents:
TWLO Balance Sheet
Enable JavaScript and reload
Cash and Cash Equivalents:
Short-Term Investments:
Accounts Receivable, Net:
Inventories:
Total Current Assets:
Property, Plant & Equipment, Net:
Total Assets:
Accounts Payable:
Current Portion of Long-Term Debt:
Total Short-Term Liabilities:
Long Term Debt, Non-Current Portion:
Total Long-Term Liabilities:
Total Liabilities:
COMPANY PROFILE
Summary of Significant Accounting Policies (a) Basis of Presentation
The accompanying consolidated financial statements have been prepared in accordance with generally accepted accounting principles in the United States of America (“U.S. GAAP”).
(b) Principles of Consolidation
The consolidated financial statements include the Company and its wholly owned subsidiaries. All significant intercompany balances and transactions have been eliminated.
(c) Use of Estimates
The preparation of financial statements in conformity with U.S. GAAP requires management to make estimates and assumptions that affect the reported amounts of assets and liabilities, disclosure of contingent assets and liabilities at the date of the financial statements and the reported amounts of revenues and expenses during the reporting period. These estimates are used for, but not limited to, revenue allowances and sales credit reserves; recoverability of long-lived and intangible assets; capitalization and useful life of the Company’s capitalized internal-use software development costs; fair value of acquired intangible assets and goodwill; accruals and contingencies. Estimates are based on historical experience and on various assumptions that the Company believes are reasonable under current circumstances. However, future events are subject to change and best estimates and judgments may require further adjustments, therefore, actual results could differ materially from those estimates. Management periodically evaluates such estimates and they are adjusted prospectively based upon such periodic evaluation.
(d) Concentration of Credit Risk
Financial instruments that potentially expose the Company to a concentration of credit risk consist primarily of cash, cash equivalents, restricted cash, marketable securities and accounts receivable. The Company maintains cash, restricted cash, cash equivalents and marketable securities with financial institutions that management believes are financially sound and have minimal credit risk exposure although the balances will exceed insured limits.
The Company sells its services to a wide variety of customers. If the financial condition or results of operations of any significant customer deteriorates substantially, operating results could be adversely affected. To reduce credit risk, management performs credit evaluations of the financial condition of significant customers. The Company does not require collateral from its credit customers and maintains reserves for estimated credit losses on customer accounts when considered necessary. Actual credit losses may differ from the Company’s estimates. During the years ended December 31, 2021, 2020 and 2019, no customer organization accounted for more than 10% of the Company’s total revenue.
As of December 31, 2021 and 2020, no customer organization represented more than 10% of the Company’s gross accounts receivable.
(e) Revenue Recognition
Revenue is recognized upon transfer of control of promised products or services to customers in an amount that reflects the consideration the Company expects to receive in exchange for those products or services. The Company enters into contracts that can include various combinations of products and services, which are generally capable of being distinct and accounted for as separate performance obligations. Revenue is recognized net of allowances for credits and any taxes collected from customers, which are subsequently remitted to governmental authorities.
The Company determines revenue recognition through the following steps:
• Identification of the contract, or contracts, with a customer;
• Identification of the performance obligations in the contract;
• Determination of the transaction price;
• Allocation of the transaction price to the performance obligations in the contract; and,
• Recognition of revenue when, or as, the Company satisfies a performance obligation.
Nature of Products and Services
The Company's revenue is
Free historical financial statements for Twilio Inc. See how revenue, income, cash flow, and balance sheet financials have changed over 37 quarters since 2017. Compare with TWLO stock chart to see long term trends.
Data imported from Twilio Inc SEC filings. Check original filings before making any investment decision.