Technology › Semiconductors And Related Devices

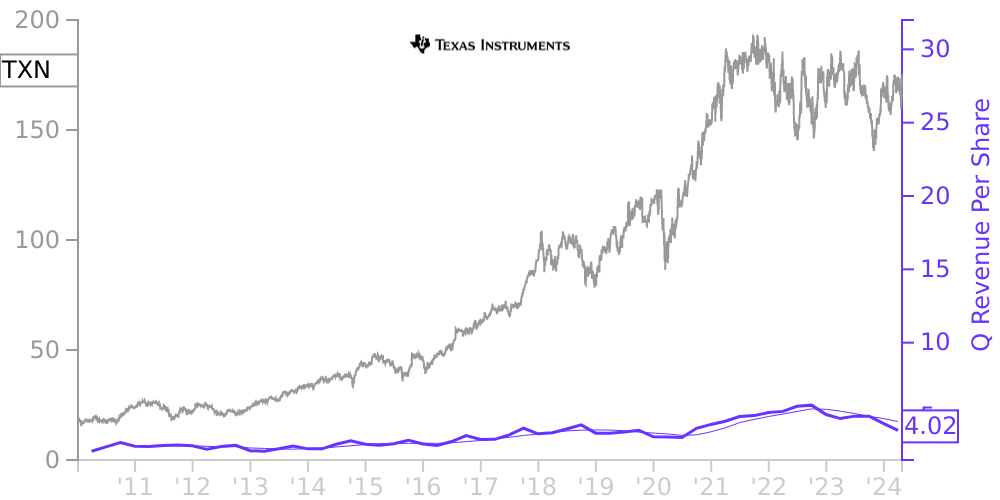
TXN Stock Price Correlated With Texas Instruments Financials
External Links ⌄
Income Statement
Cash Flow
Balance Sheet
TXN Income Statement
Enable JavaScript and reload
Revenue, Net:
Cost of Goods & Services Sold:
Gross Profit:
Selling, General & Admin Expense:
Research & Development Expense:
Total Operating Expenses:
Operating Income:
Income Taxes:
Net Income:
TXN Cash Flow
Enable JavaScript and reload
Operating Activities Net Income:
Depreciation, Depletion & Amortization:
Change in Accounts Receiveable:
Net Cash from Operations:
Repurchases/Buybacks Common Stock:
Issuance of Long-term Debt:
Cash Dividends Paid:
Net Cash from Financing Activities:
Property, Plant & Equipment Purchases:
Purchases of Businesses, Net of Cash:
Net Cash from Investing Activities:
Net Change in Cash & Equivalents:
TXN Balance Sheet
Enable JavaScript and reload
Cash and Cash Equivalents:
Short-Term Investments:
Accounts Receivable, Net:
Inventories:
Total Current Assets:
Property, Plant & Equipment, Net:
Total Assets:
Accounts Payable:
Current Portion of Long-Term Debt:
Total Short-Term Liabilities:
Long Term Debt, Non-Current Portion:
Total Long-Term Liabilities:
Total Liabilities:
COMPANY PROFILE
Description of business, including segment and geographic area information We design, make and sell semiconductors to electronics designers and manufacturers all over the world. We have two reportable segments, Analog and Embedded Processing, each of which represents groups of similar products that are combined on the basis of similar design and development requirements, product characteristics, manufacturing processes and distribution channels.
• Analog semiconductors change real-world signals, such as sound, temperature, pressure or images, by conditioning them, amplifying them and often converting them to a stream of digital data that can be processed by other semiconductors, such as embedded processors. Analog semiconductors are also used to manage power in all electronic equipment by converting, distributing, storing, discharging, isolating and measuring electrical energy, whether the equipment is plugged into a wall or using a battery. Our Analog segment consists of two major product lines: Power and Signal Chain.
• Embedded Processing products are the digital “brains” of many types of electronic equipment. They are designed to handle specific tasks and can be optimized for various combinations of performance, power and cost, depending on the application.
We report the results of our remaining business activities in Other. Other includes operating segments that do not meet the quantitative thresholds for individually reportable segments and cannot be aggregated with other operating segments. Other includes DLP ® products, calculators and custom ASIC products.
In Other, we also include items that are not used in evaluating the results of or in allocating resources to our segments. Examples of these items include acquisition, integration and restructuring charges (see Note 11); and certain corporate-level items, such as litigation expenses, environmental costs, insurance settlements, and gains and losses from other activities, including asset dispositions. We allocate the remainder of our expenses associated with corporate activities to our operating segments based on specific methodologies, such as percentage of operating expenses or headcount.
Our centralized manufacturing and support organizations, such as facilities, procurement and logistics, provide support to our operating segments, including those in Other. Costs incurred by these organizations, including depreciation, are charged to the segments on a per-unit basis. Consequently, depreciation expense is not an independently identifiable component within the segments’ results and, therefore, is not provided.
With the exception of goodwill, we do not identify or allocate assets by operating segment, nor does the chief operating decision maker evaluate operating segments using discrete asset information. We have no material intersegment revenue. The accounting policies of the segments are consistent with those described in the summary of significant accounting policies and practices.
Segment information For Years Ended December 31, 2021 2020 2019 Revenue: Analog $ 14,050 $ 10,886 $ 10,223 Embedded Processing 3,049 2,570 2,943 Other 1,245 1,005 1,217 Total revenue $ 18,344 $ 14,461 $ 14,383 Operating profit: Analog $ 7,393 $ 4,912 $ 4,477 Embedded Processing 1,174 743 907 Other 393 239 339 Total operating profit $ 8,960 $ 5,894 $ 5,723
Geographic area information
The following geographic area information includes revenue, based on product shipment destination, and property, plant and equipment, based on physical location. The geographic revenue information does not necessarily reflect end demand by geography because our products tend to be shipped to the locations where our customers manufacture their products. For Years Ended December 31, 2021 2020 2019 Revenue: United States $ 1,906 $ 1,547 $ 1,827 Asia (a) 12,185 9,541 8,650 Europe, Middle East and Africa 2,802 2,249 2,707 Japan 959 734 796 Rest of world 492 390 403 Total revenue $ 18,344 $ 14,461 $ 14,383
Free historical financial statements for Texas Instruments Inc.. See how revenue, income, cash flow, and balance sheet financials have changed over 65 quarters since 2010. Compare with TXN stock chart to see long term trends.
Data imported from Texas Instruments Inc. SEC filings. Check original filings before making any investment decision.