Industrials › Aircraft And Parts

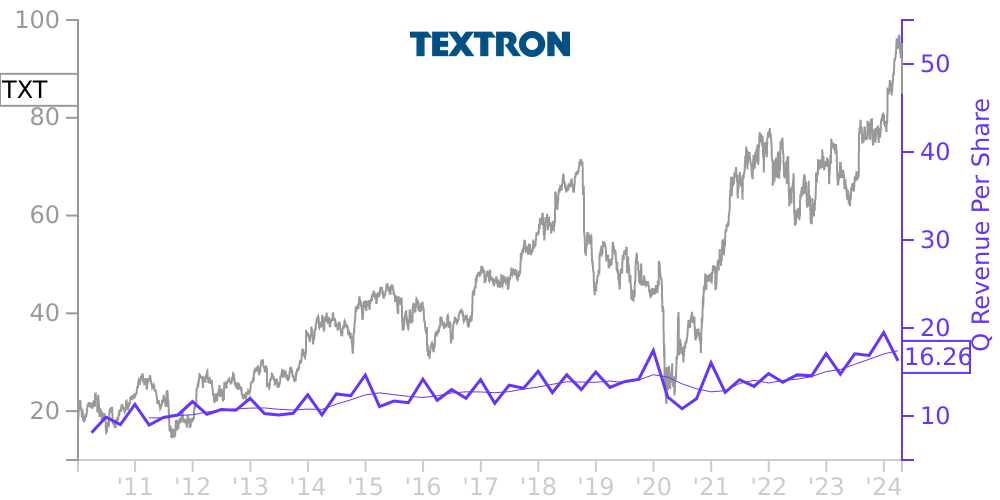
TXT Stock Price Correlated With Textron Financials
External Links ⌄
Income Statement
Cash Flow
Balance Sheet
TXT Income Statement
Enable JavaScript and reload
Revenue, Net:
Cost of Goods & Services Sold:
Gross Profit:
Selling, General & Admin Expense:
Research & Development Expense:
Total Operating Expenses:
Operating Income:
Income Taxes:
Net Income:
TXT Cash Flow
Enable JavaScript and reload
Operating Activities Net Income:
Depreciation, Depletion & Amortization:
Change in Accounts Receiveable:
Net Cash from Operations:
Repurchases/Buybacks Common Stock:
Issuance of Long-term Debt:
Cash Dividends Paid:
Net Cash from Financing Activities:
Property, Plant & Equipment Purchases:
Purchases of Businesses, Net of Cash:
Net Cash from Investing Activities:
Net Change in Cash & Equivalents:
TXT Balance Sheet
Enable JavaScript and reload
Cash and Cash Equivalents:
Short-Term Investments:
Accounts Receivable, Net:
Inventories:
Total Current Assets:
Property, Plant & Equipment, Net:
Total Assets:
Accounts Payable:
Current Portion of Long-Term Debt:
Total Short-Term Liabilities:
Long Term Debt, Non-Current Portion:
Total Long-Term Liabilities:
Total Liabilities:
COMPANY PROFILE
Basis of Presentation Our Consolidated Financial Statements include the accounts of Textron Inc. (Textron) and its majority-owned subsidiaries. We have prepared these unaudited consolidated financial statements in accordance with accounting principles generally accepted in the U.S. for interim financial information. Accordingly, these interim financial statements do not include all of the information and footnotes required by accounting principles generally accepted in the U.S. for complete financial statements. The consolidated interim financial statements included in this quarterly report should be read in conjunction with the consolidated financial statements included in our Annual Report on Form 10-K for the year ended January 1, 2022. In the opinion of management, the interim financial statements reflect all adjustments (consisting only of normal recurring adjustments) that are necessary for the fair presentation of our consolidated financial position, results of operations and cash flows for the interim periods presented. The results of operations for the interim periods are not necessarily indicative of the results to be expected for the full year.
Our financings are conducted through two separate borrowing groups. The Manufacturing group consists of Textron consolidated with its majority-owned subsidiaries that operate in the Textron Aviation, Bell, Textron Systems and Industrial segments. The Finance group, which also is the Finance segment, consists of Textron Financial Corporation and its consolidated subsidiaries. We designed this framework to enhance our borrowing power by separating the Finance group. Our Manufacturing group operations include the development, production and delivery of tangible goods and services, while our Finance group provides financial services. Due to the fundamental differences between each borrowing group’s activities, investors, rating agencies and analysts use different measures to evaluate each group’s performance. To support those evaluations, we present balance sheet and cash flow information for each borrowing group within the Consolidated Financial Statements. All significant intercompany transactions are eliminated from the Consolidated Financial Statements, including retail financing activities for inventory sold by our Manufacturing group and financed by our Finance group.
Use of Estimates
We prepare our financial statements in conformity with generally accepted accounting principles, which require us to make estimates and assumptions that affect the amounts reported in the financial statements. Actual results could differ from those estimates. Our estimates and assumptions are reviewed periodically, and the effects of changes, if any, are reflected in the Consolidated Statements of Operations in the period that they are determined.
Contract Estimates
For contracts where revenue is recognized over time, we recognize changes in estimated contract revenues, costs and profits using the cumulative catch-up method of accounting. This method recognizes the cumulative effect of changes on current and prior periods with the impact of the change from inception-to-date recorded in the current period. Anticipated losses on contracts are recognized in full in the period in which the losses become probable and estimable.
In the first quarter of 2022, our cumulative catch-up adjustments decreased segment profit by $17 million and net income by $13 million, $0.06 per diluted share. In the first quarter of 2021, our cumulative catch-up adjustments increased segment profit by $14 million and net income by $11 million, $0.05 per diluted share. Gross favorable profit adjustments totaled $16 million and $36 million in the first quarter of 2022 and 2021, respectively, and gross unfavorable profit adjustments totaled $33 million and $22 million, respectively. We reduced revenues by $12 million and recognized revenues of $18 million in the first quarter of 2022 and 2021, respectively,
Free historical financial statements for Textron Inc. See how revenue, income, cash flow, and balance sheet financials have changed over 65 quarters since 2010. Compare with TXT stock chart to see long term trends.
Data imported from Textron Inc SEC filings. Check original filings before making any investment decision.